7 Teresópolis — Córrego do Príncipe
This chapter applies the Part 2 methodology, step by step, to the Córrego do Príncipe (Rio Iconha) valley in Teresópolis, Rio de Janeiro State (RJ) — the scene of the municipality’s deadliest debris flow in January 2011 and the site of the pilot permeable Sabo barrier of the SABO Project, a cooperation between JICA (Japan International Cooperation Agency) and MIDR (Brazil’s Ministry of Integration and Regional Development). The theory shared by the three cases (frequency analysis of annual maxima, rainfall disaggregation, alternating block method, SCS-CN, climate change factors and the volume accounting of the GIDES/JICA debris-flow manual) is detailed in the Nova Friburgo chapter; here it is summarized, but every step and every number of this case is presented.
Every number in the text comes from a pipeline file (folder data/cases/teresopolis/ of the companion repository) or from a cited reference. Sections 1 to 7 cover the context, the reference point, the input data, the watershed, the design rainfall, climate change and the traditional GIDES/JICA method; sections 8 to 12 cover the TRIGRS modeling, the calibration against the 2011 scars, the step from TRIGRS to Vdy12 and the rainfall thresholds, with the numbers of the full pipeline run (decisions D20 and D21), read from the products by scripts/capitulos/gerar_resultados_trigrs.py; if any of them stops being final, a notice appears at the start of the TRIGRS section (Section 7.8). The code shown consists of listings that are not executed when the book is rendered (equivalent to eval: false); the complete scripts are in scripts/casos/teresopolis/ (sections 1 to 7) and in scripts/pipeline/ and src/trigrs_mapper/ (sections 8 to 12).
7.1 Disaster context
7.1.1 The January 11–12, 2011 event
The mega-disaster in the Rio de Janeiro Highlands (Região Serrana) resulted from the second South Atlantic Convergence Zone (SACZ) episode of January 2011 (January 11–16), enhanced by a favorable phase of the Madden–Julian Oscillation, which produced persistent rainfall over the mountainous areas of Rio de Janeiro State (Climanálise, 2011). During the night of January 11–12, a convective system fed by Amazonian moisture poured very localized rainfall over the valley headwaters, lasting about 4.5 h (Pelizoni, 2014, cited in Brasil/MI, 2018). The preceding weeks had been wet: JICA (2026, Part 3) reports 707 mm in December 2010 at the INMET (Brazil’s National Institute of Meteorology) Teresópolis station; at rain gauge 2242072 (Teresópolis/INMET, in the database of the DPM — the Department of Disaster Prevention and Mitigation of SEDEC/MIDR, Brazil’s National Secretariat of Civil Protection and Defense) the December total was 446.6 mm.
Rainfall in the watershed was not measured: there was no gauge in the valley in 2011. The available values vary by a factor of nearly three, which makes the event forcing the largest uncertainty of the calibration (Table 7.1).
| Source | Location | Rainfall |
|---|---|---|
| Rain gauge 2242072 Teresópolis (INMET), DPM database | plateau, 12.0 km SE of the point | 43.4 mm (Jan 11 reading) + 124.6 mm (Jan 12 reading) |
| INMET Teresópolis (JICA, 2026, Part 3) | Teresópolis | 90.8 mm/24 h; maximum of 17.6 mm/h |
| Rain gauge 2242027 Fazenda Sobradinho | 22.3 km NNE | 104.3 + 145.5 mm (249.8 mm in two days) |
| Cabral et al. (2023) | Teresópolis (Vieira, Príncipe) | 161.6 mm/24 h |
| JICA (2026, Part 1) | Córrego do Príncipe | 264 mm/24 h (primary source not cited) |
| Cabral et al. (2023) | Vale do Cuiabá (Petrópolis), ~8 km west | 273.8 mm/24 h |
| Hourly MERGE/CPTEC-INPE, 0.1° cell of the point | cell average | 28.2 + 81.6 mm (reading days Jan 11 and 12) |
7.1.2 The Córrego do Príncipe debris flow
The debris flow of January 12, 2011 traveled ≈ 4.8 km, from upper Campo Grande, through the Posse neighborhood, to the Cascata do Imbuí, at the confluence with the Paquequer River: an erosion/transport zone of 2.06 km (20 ha) between elevations 1,000 and 870 m and a deposition zone of 2.73 km (28.4 ha). Four valley constrictions (at 1,000 m, 910 m, 870 m and 860 m) temporarily dammed the flow, leaving mud marks 3 to 6 m high; the bed was scoured by ≈ 3.5 m in Campo Grande; boulders larger than 10 m³ were exhumed from old deposits — evidence of recurrence — and fine-sediment deposits exceeded 2 m in thickness (Conq et al., 2015). The event affected 65,585 m² of buildings and severely damaged 42% of the structures in the valley (Conq et al., 2015). According to JICA (2026, Part 1), the disaster “claimed more than 100 victims” (vitimou mais de 100 pessoas) in the Córrego do Príncipe and was the worst debris-flow catastrophe in the municipality; the number of deaths in the valley itself was not found in the official tolls. Residents reported a water level of 5 m at the valley outlet (JICA, 2026, Part 3). In Teresópolis, the official toll of the 2011 disaster, compiled by the Rio de Janeiro State Civil Defense Secretariat and Fire Department (SEDEC-RJ/CBMERJ; Santos, 2013), is 392 deaths, with 6,727 people made homeless and 9,110 displaced (World Bank, 2012).
In the regional description, the watershed lies in the domain of the Serra dos Órgãos Suite and the Rio Negro Complex, with the Teresópolis Granite; the thin Cambisols (Cambissolos) explain the shallow landslides at the soil/rock contact, and the valleys hold colluvium up to tens of meters thick with boulders in a clayey matrix (Conq et al., 2015). On the 1:100,000 geological map used in the model, the watershed contains only the Rio Negro Complex and the Teresópolis Granite (Section 7.3). After 2011, INEA (the Rio de Janeiro State Environmental Institute) installed two flexible barriers near the valley outlet, and the SABO Project (JICA/MIDR) designed for the 3.19 km² target watershed Brazil’s first permeable steel-lattice Sabo barrier (9.5 m high, 46.5 m long, with a clear spacing of 1.6 m = 2 × D80, where D80 = 0.80 m), for a design volume of 73,000 m³ and a debris-flow peak discharge of 200 m³/s (JICA, 2026, Part 3).
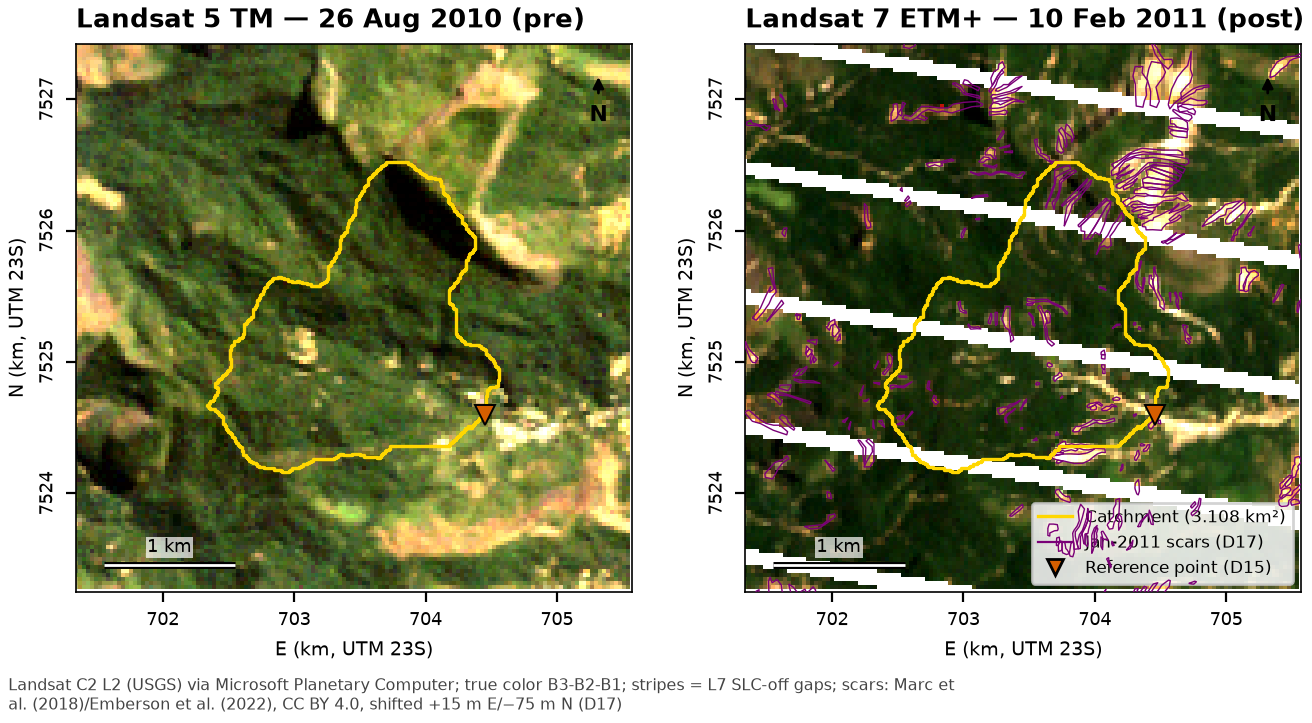
Why this site. The coordinate given by the authors (22°22’19.39”S 43°00’56.63”W) marks the outlet of the upper Córrego do Príncipe valley, where the Campo Grande neighborhood begins; the valley’s 2011 scars were mapped manually in the open inventory of Marc et al. (2018) and Emberson et al. (2022), and the watershed coincides with that of the official design, which allows both the traditional method and the TRIGRS coupling to be compared with a real project. Landsat images before and after the event (Figure 7.1) show the scars in the watershed and in the neighboring valleys.
7.2 Siting the Sabo dam and defining the reference point
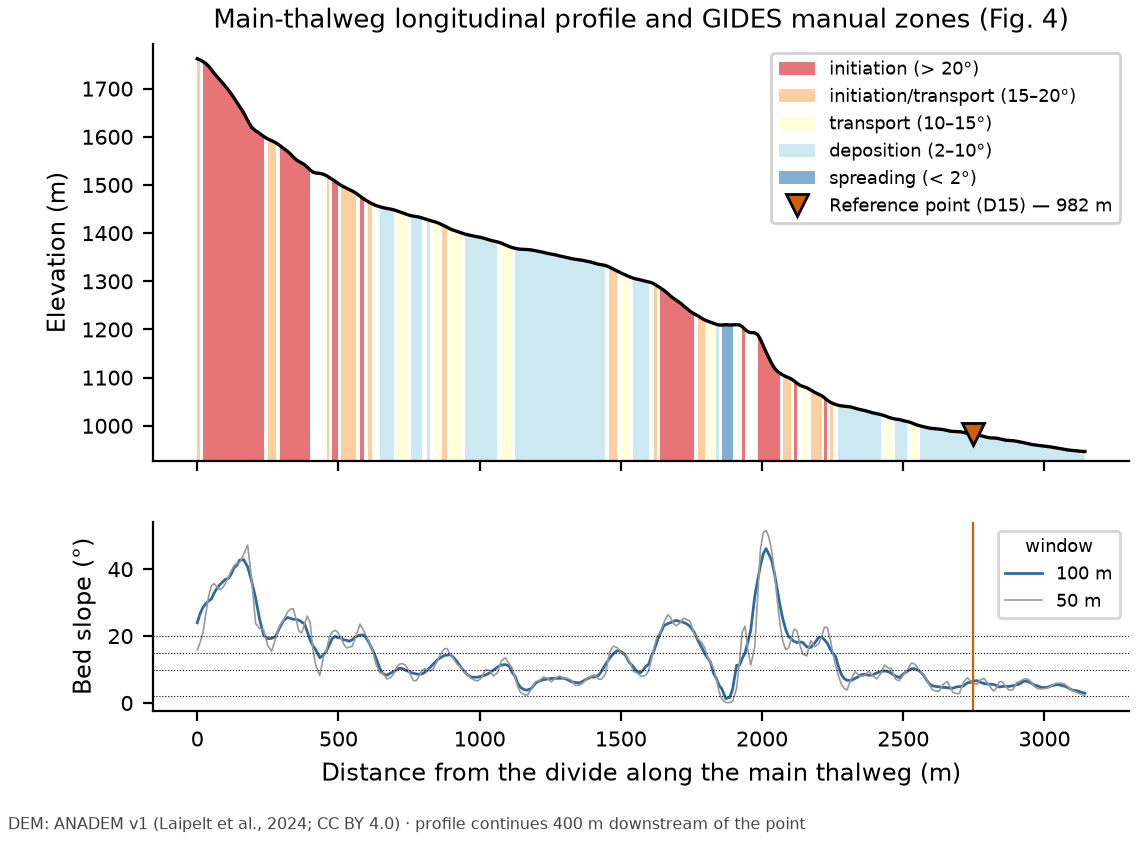
The GIDES manual (§2.4, Fig. 4) places the reference point downstream of the transport zone and upstream of the area to be protected, where the bed slope drops below ~10° and deposition begins; NILIM TN 904 (Technical Note No. 904 of Japan’s National Institute for Land and Infrastructure Management, §2.4) adds that “in general, the valley outlet upstream of the objects to be protected, that is, the downstream end of the transport reach, is the reference point”. The slope bands of Fig. 4 are: > 20° initiation; 15–20° initiation/transport; 10–15° transport; 2–10° deposition; < 2° spreading.
The given coordinate lies 28 m from the D8 channel of the Córrego do Príncipe, where the valley opens onto the built-up area. The siting step (report 10 and project decision D15) evaluated five candidates (Table 7.2) and adopted point TR-E, just below the confluence with the 0.56 km² southern tributary, which joins ~110 m downstream of the given point. The final point therefore drains the entire watershed at the valley outlet — 3.108 km², equivalent to the SABO Project’s 3.19 km² target watershed.
| Point | E / N (m) | Elevation (m) | Area (km²) | Slope 50 m / 200 m upstr. / 100 m downstr. (°) | 2011 scars (n; m²) | OSM buildings in the watershed |
|---|---|---|---|---|---|---|
| TR-E (adopted, D15) | 704,455 / 7,524,595 | 982 | 3.108 | 5.7 / 5.7 / 5.7 | 54; 159,643 | 10 |
| TR-A (on the channel next to the given point, 2.42 km²) | 704,335 / 7,524,655 | 995 | 2.422 | 4.0 / 8.9 / 4.2 | 43; 128,596 | 8 |
| TR-B (southern tributary, 0.56 km²) | 704,375 / 7,524,605 | 996 | 0.558 | 21.4 / 12.9 / 8.2 | 12; 28,935 | 0 |
| TR-C (outlet of the northern branch) | 704,095 / 7,524,875 | 1,053 | 0.896 | 22.6 / 21.1 / 9.7 | 16; 73,612 | 0 |
| TR-D (outlet of the western branch) | 703,935 / 7,524,865 | 1,062 | 1.281 | 14.8 / 13.8 / 9.5 | 22; 43,600 | 3 |
| Item | Value |
|---|---|
| Coordinates (SIRGAS 2000 / UTM 23S) | 704,455 E / 7,524,595 N |
| Latitude / longitude | 22°22’20.92”S / 43°00’51.49”W |
| Elevation (ANADEM) | 982 m |
| Distance to the given point | 154 m |
| Bed slope: local 50 m / 200 m upstream / 100 m downstream | 5.7° / 5.7° / 5.7° (deposition zone) |
| Cross section at the point (widths up to 1, 2, 5 and 10 m above the bed) | W1 = 14 m; W2 = 22 m; W5 = 38 m; W10 = 60 m (V-shaped valley, side slopes of 17–18°) |
| First OSM building downstream (along the flow path) | 410 m |
| Downstream exposure (50 m × 500 m corridor) | 18 OSM buildings; 25 CNEFE 2022 addresses |
| Upstream exposure (in the watershed) | 10 OSM buildings; 21 CNEFE 2022 addresses |
| Roads in the corridor | Estrada José da Rocha, Estrada José da Rocha Junior |
The longitudinal profile (Figure 7.2; slope in a 100 m window) shows the headwall escarpment, from the divide (1,762 m) down to 1,596 m, with slopes of up to 43°; alternating initiation/transport reaches and depositional benches in the middle of the watershed; a steep step between 1,194 and 1,102 m (up to 46°, ~734 m from the point); and, over the last 199 m (from 1,002 m), the valley with slopes below 10° (mean of 5.9°) where the point lies. The SABO Project’s point was also placed “at the valley outlet — the point at which the spreading of the 2011 debris flow began”, with a bed slope of 4.4°, the θ used for Cd in the official design (JICA, 2026, Part 3; Table 7.28). The report also describes this slope as ≈ 1:10, but 1:10 corresponds to 5.7°, and 4.4° to ≈ 1:13.
The watershed contains 10 OpenStreetMap buildings and 21 CNEFE 2022 addresses — a cluster at the confluence of the northern and western branches and houses along the Estrada José da Rocha road. According to the manual (§2.4), protecting them would require auxiliary reference points at the branch outlets (candidates TR-C and TR-D), with TR-E as the reference point for the whole system.
7.3 Input datasets
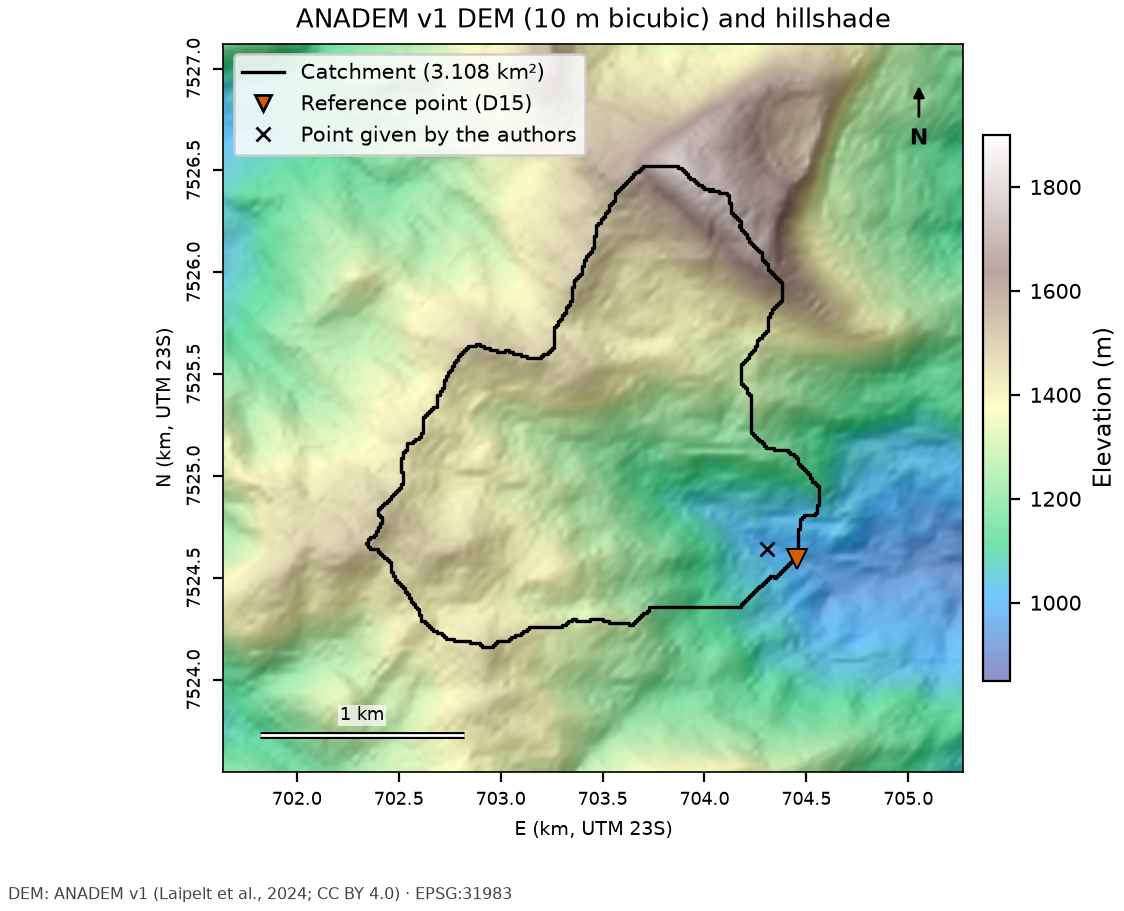
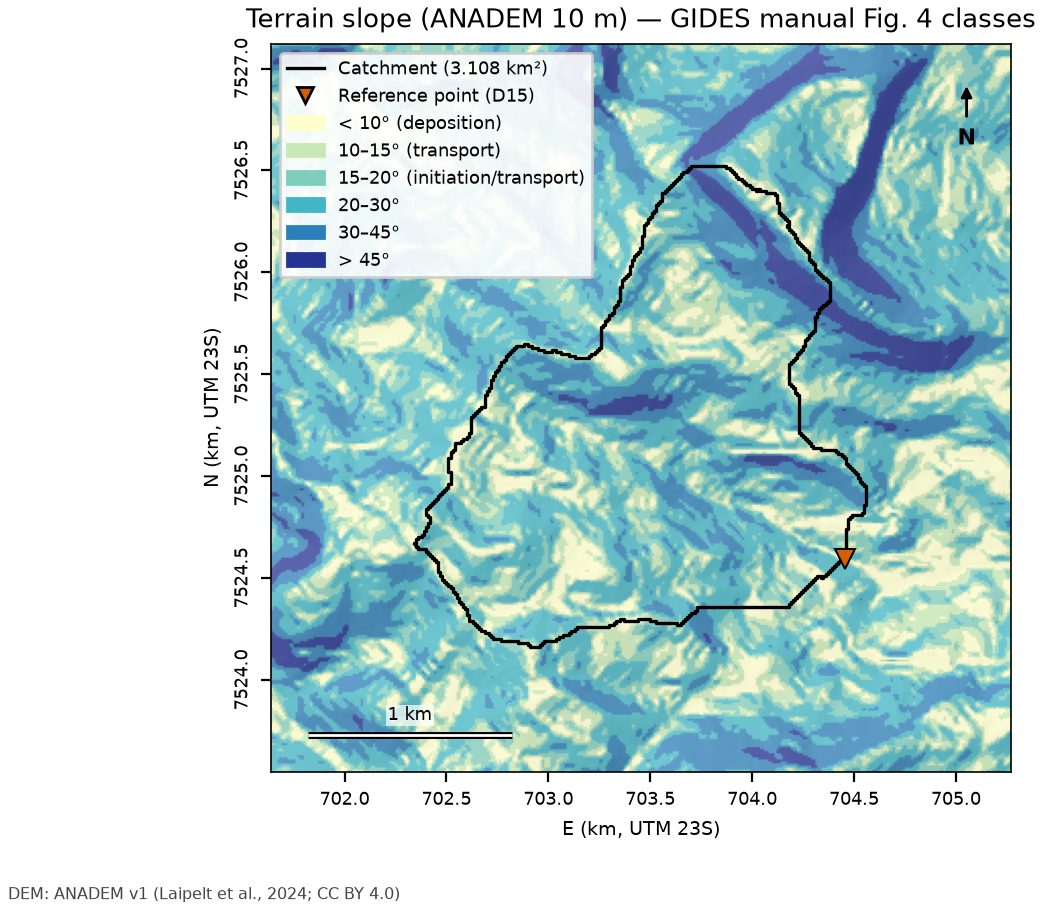
The datasets were standardized to SIRGAS 2000 / UTM zone 23S (EPSG:31983) in step 05 and clipped to the case window. Table 7.4 summarizes source, resolution and license; the following figures show one map per layer.
| Layer | Source | Resolution/scale | Date | License |
|---|---|---|---|---|
| DEM and shaded relief | ANADEM v1 (Laipelt et al., 2024) | ~30 m; resampled to 10 m (bicubic) | Copernicus GLO-30 (2011–2015) with vegetation removed | CC BY 4.0 |
| Slope | derived from ANADEM 10 m | 10 m | — | — |
| Soils | IBGE BDiA/MRN Pedology | 1:250,000 | RADAMBRASIL compilation, SiBCS 2021 legend | free use with attribution |
| Geology | SGB/UERJ 1:100,000 maps (Três Rios sheet) | 1:100,000 | — | SGB public data |
| Land cover (pre-event) | GLAD GLCLUC v2 (Potapov et al., 2022) | ~28 m | 2010 | CC BY |
| Land cover and land use | MapBiomas Collection 11 | 30 m | 2015 and 2025 | CC BY 4.0 |
| Texture and properties | ISRIC SoilGrids 2.0 (Poggio et al., 2021) | 250 m | — | CC BY 4.0 |
| Depth to bedrock | SoilGrids250m 2017, BDTICM (Shangguan et al., 2017) | 250 m | 2017 | ODbL |
| Event imagery | Landsat 5 TM / 7 ETM+ C2 L2 (USGS, Planetary Computer) | 30 m | Aug 26, 2010 and Feb 10, 2011 | public domain |
| Exposure | OpenStreetMap; CNEFE 2022 (IBGE, counts only) | vector | Oct 30–31, 2026 | ODbL; free use |
| 2011 scars | Marc et al. (2018); Emberson et al. (2022) | vector (manual mapping in this sector) | 2011 | CC BY 4.0 |
Within the watershed, the 1:100,000 geology is 67% Rio Negro Complex and 33% Teresópolis Granite body (Três Rios sheet); the 1:250,000 soil map has a single map unit, CXbd32 (Cambissolo Háplico Tb Distrófico — a dystrophic, low-activity-clay Haplic Cambisol — of medium and clayey texture, with humic Latossolos (Ferralsols) and inclusions of Neossolos Litólicos (Leptosols)). SoilGrids indicates, averaged over 0–100 cm in the 71 cells of 250 m that touch the watershed, 48% sand, 22% silt and 30% clay (27–38%), a bulk density of 1.06 g/cm³ and an organic carbon content of 34 g/kg; the texture classes are sandy clay loam, clay loam and sandy clay. The absolute depth to bedrock (BDTICM) ranges from 12.4 to 29.1 m (mean 16.3 m) — a regolith/saprolite value, not a mobilizable soil thickness: since it always exceeds the 5 m cap on the TRIGRS soil thickness zmax, it does not constrain the model and enters only as the spatial pattern of one zmax variant in the sensitivity analysis (Section 7.8.2); BDRICM (depth to the R horizon, capped at 2 m) has a mean of 1.74 m, and the probability of bedrock within the first 2 m (BDRLOG) is 35%. In 2010, 98% of the watershed had tree cover (GLAD).
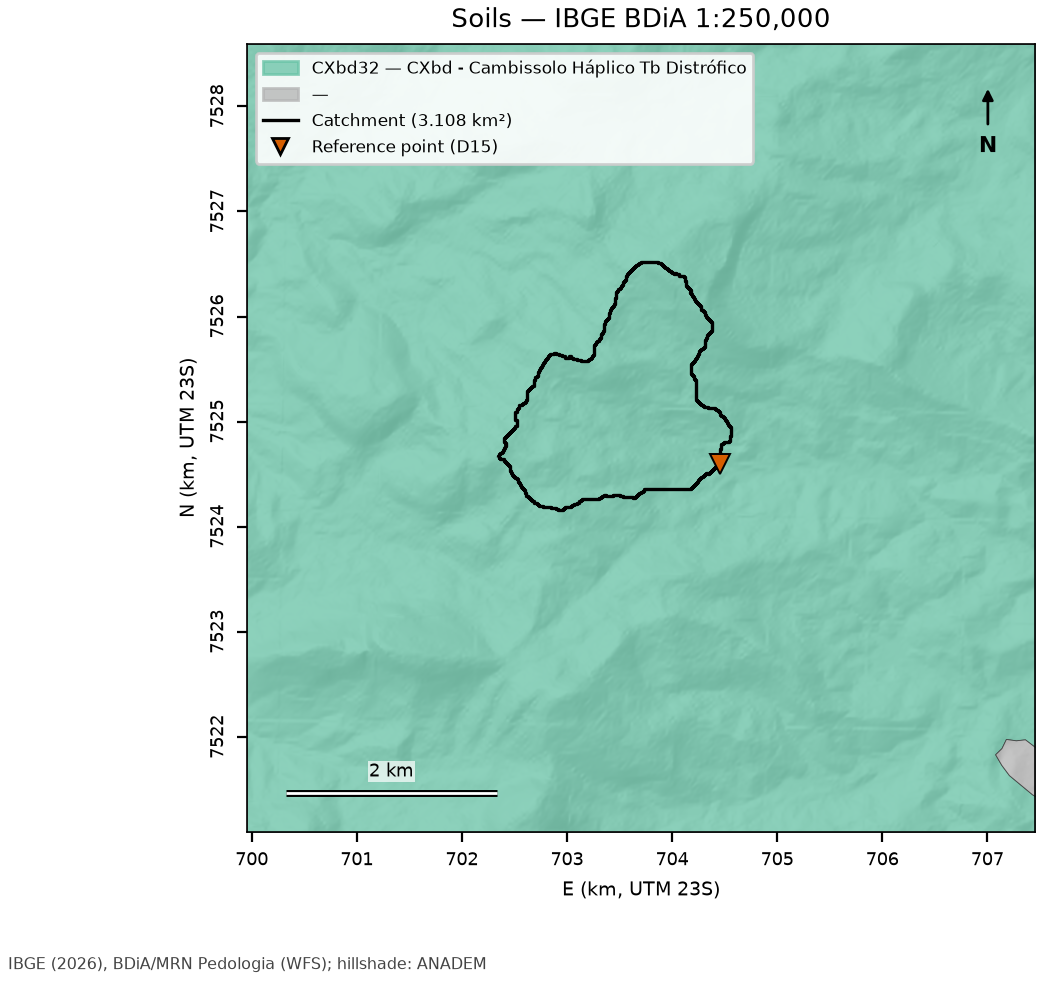
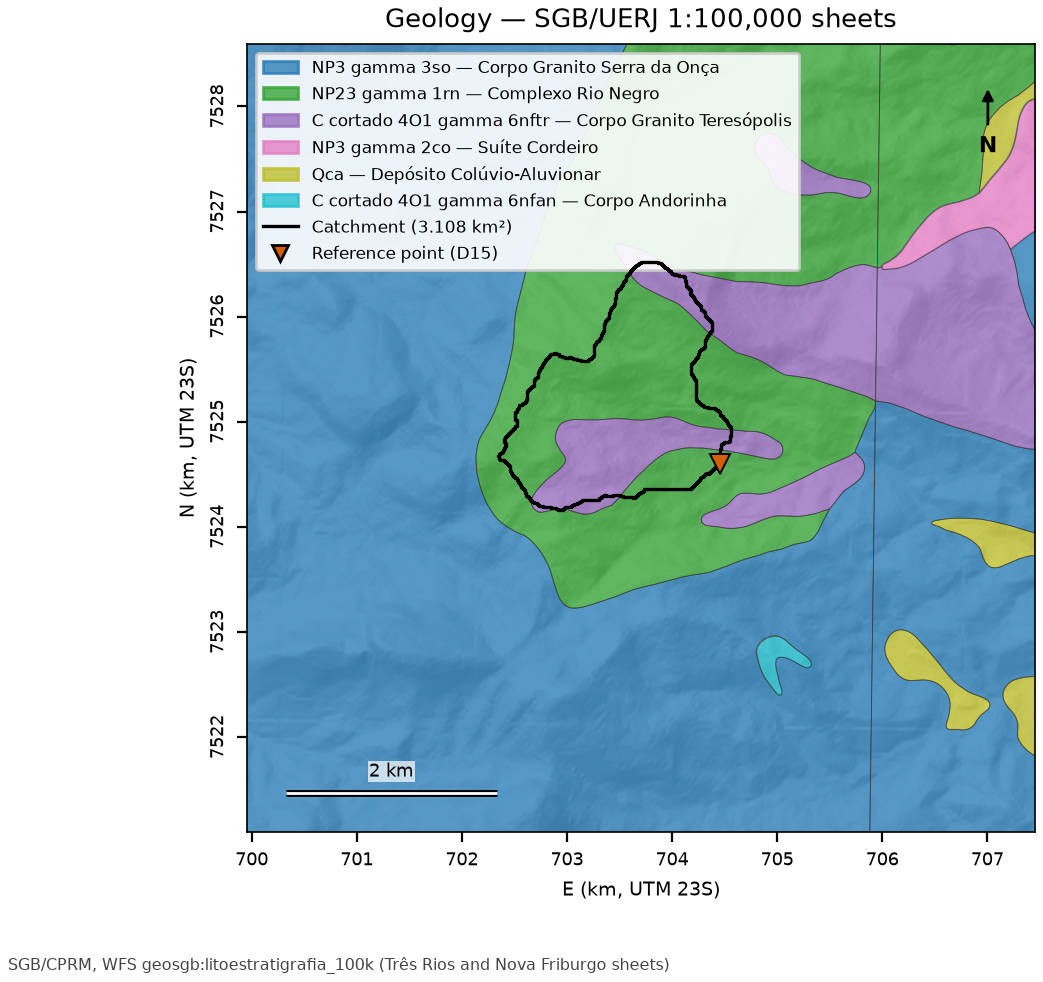
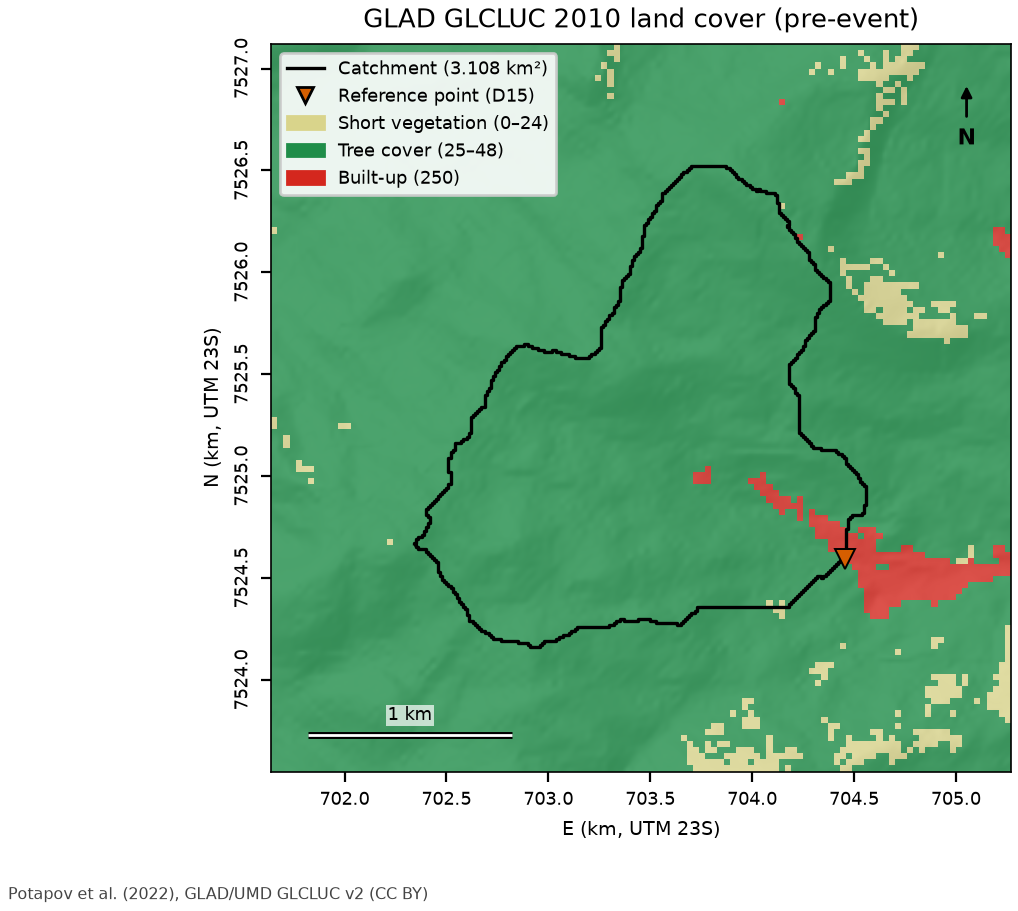
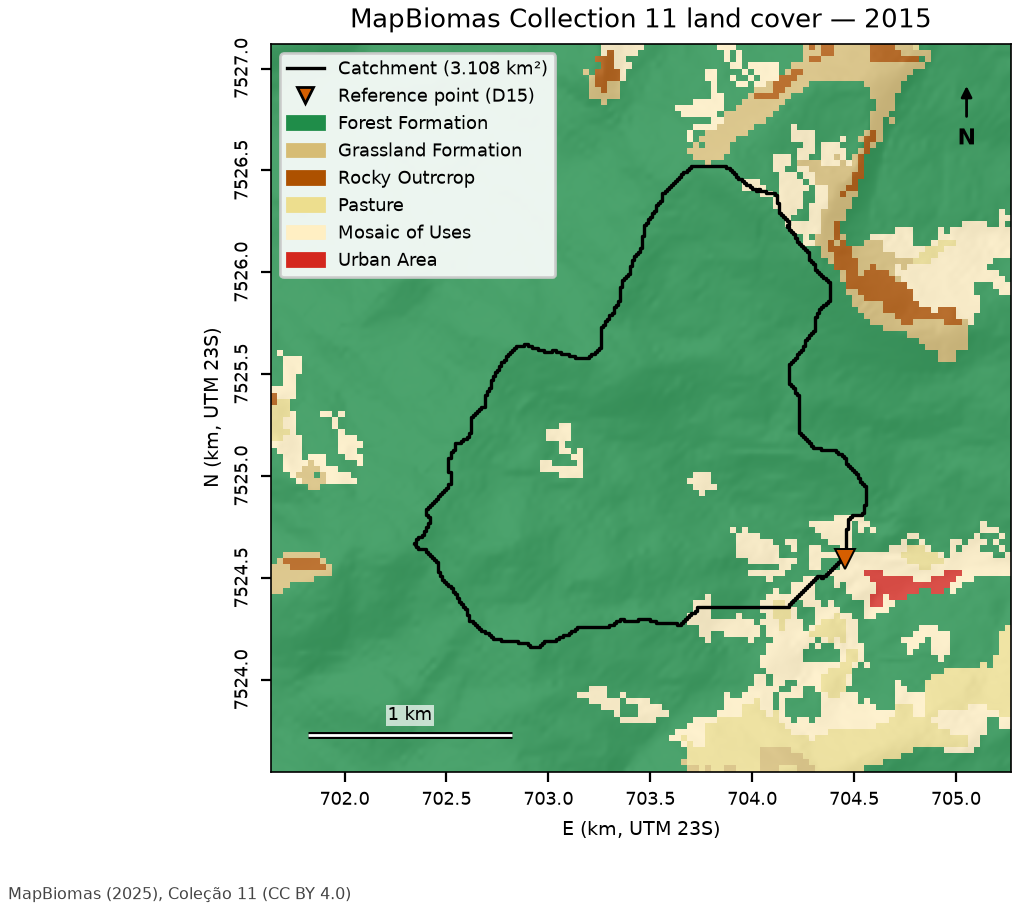
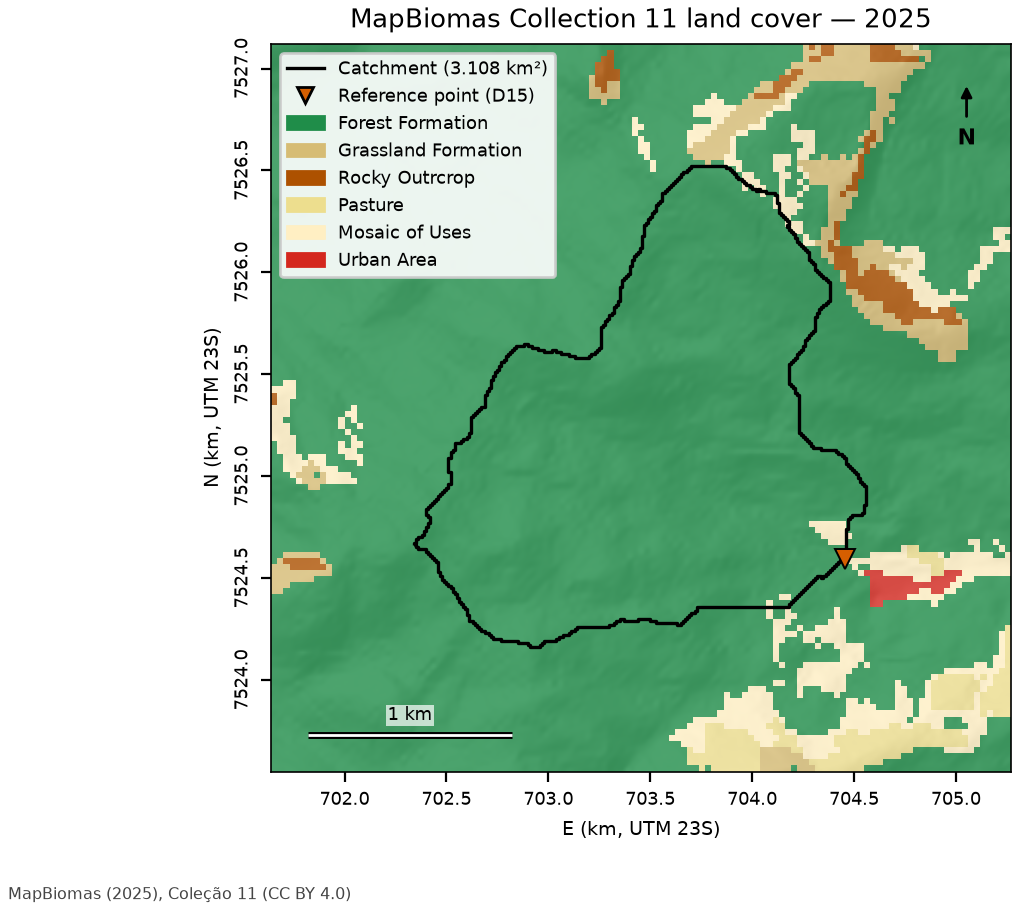
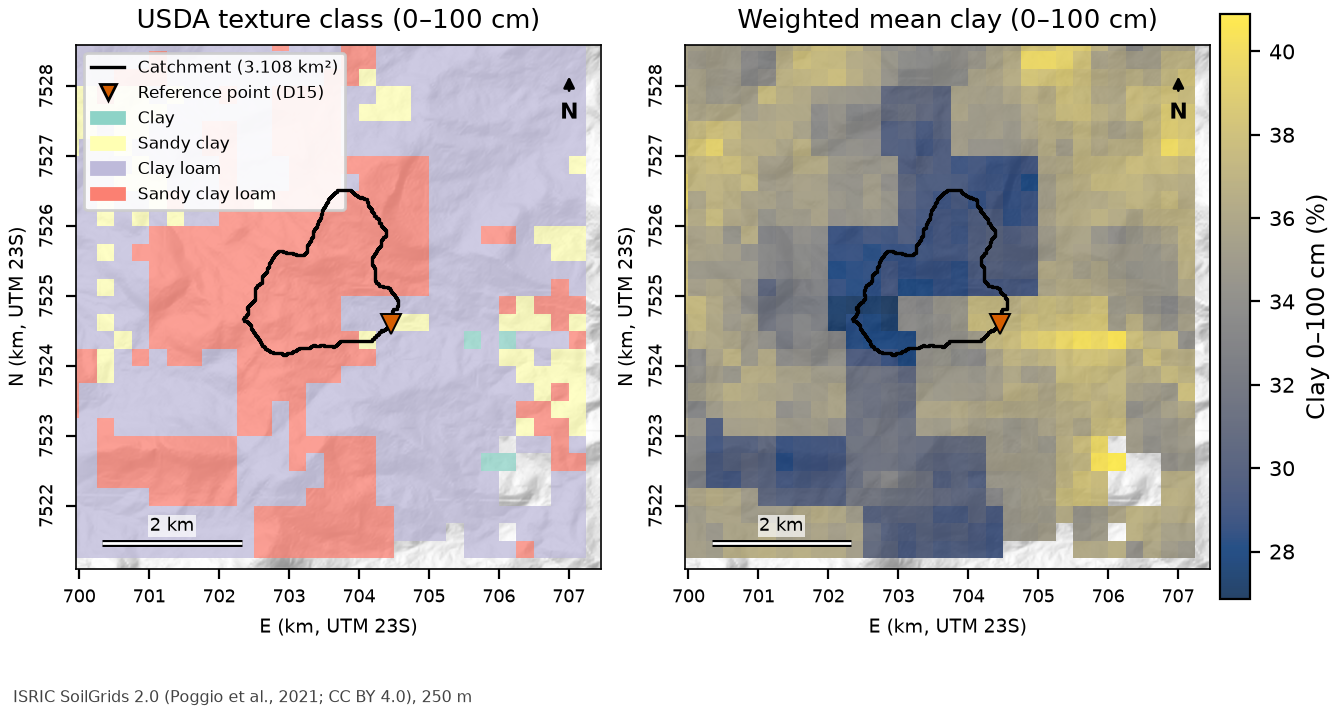
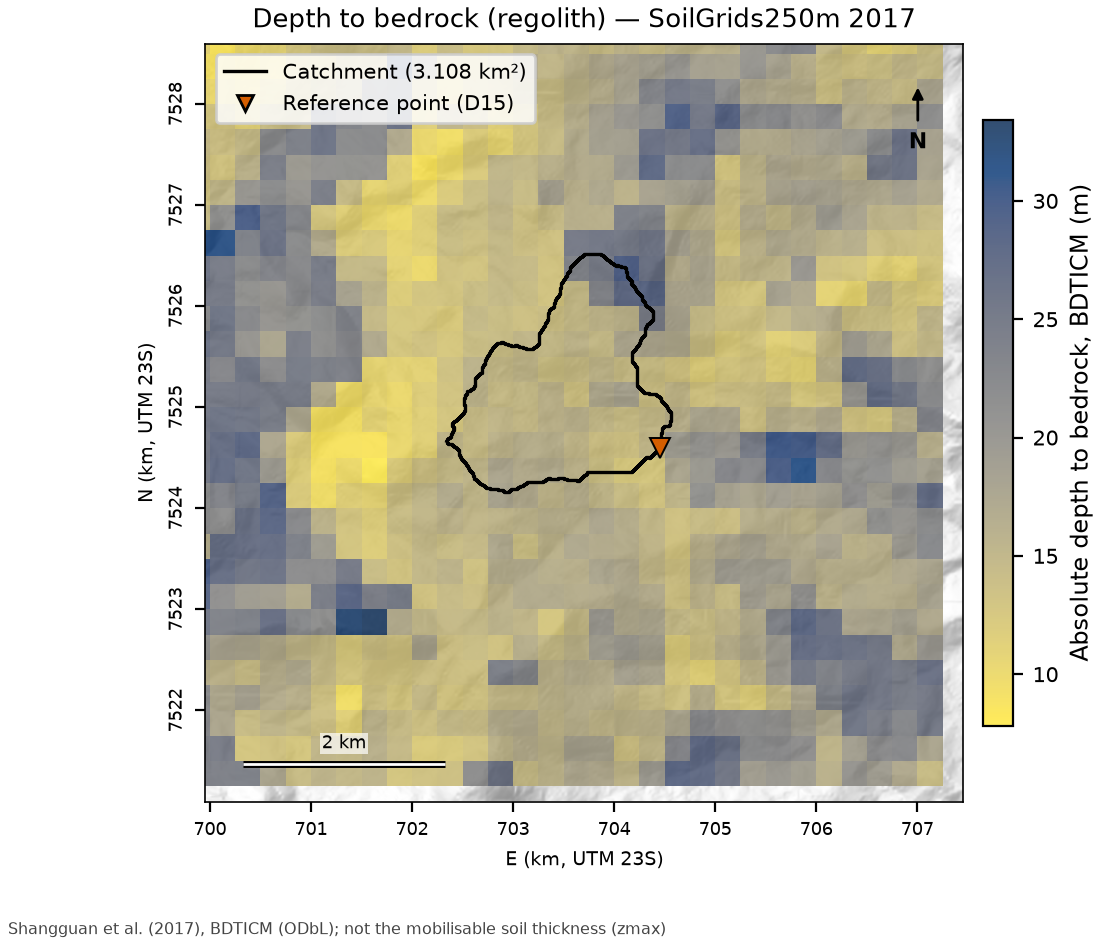
The layers derived for TRIGRS — soil thickness zmax, property zones and the initial water-table scenarios of 1 to 10 m capped at the base of the soil, i.e., the top of the bedrock (depthwt = min(d, zmax), decision D6) — are produced in the modeling step and presented in Section 7.8.
7.4 Watershed delineation and drainage network
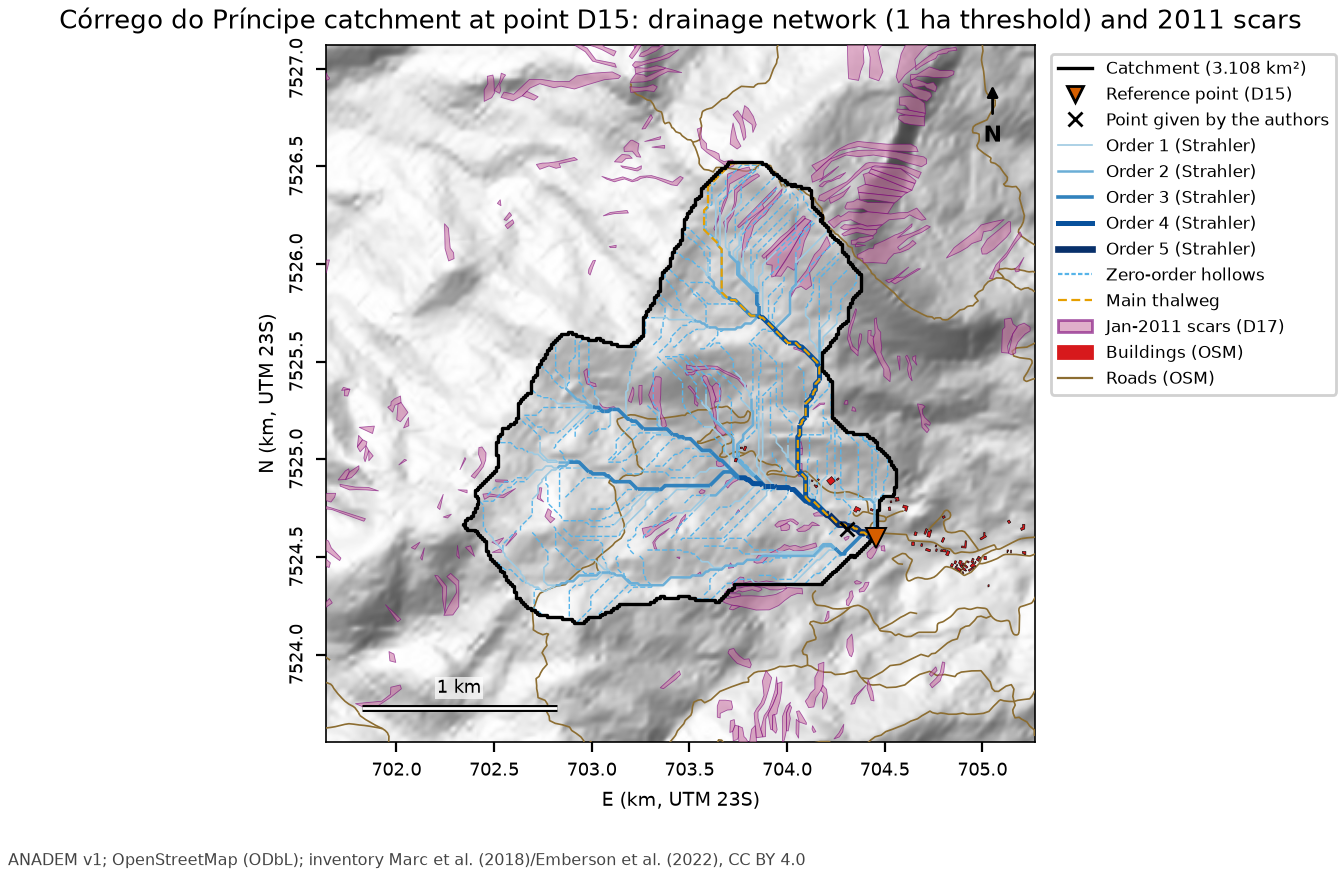
The watershed was delineated on ANADEM reprojected to EPSG:31983 (30 m bilinear and 10 m bicubic), following the procedure of chapter 6:
- Conditioning of the DEM (
pysheds: filling of pits and depressions and resolution of flats; Barnes et al.,- — within the watershed, 115 of the 31,084 cells (0.37%) changed elevation, by at most 3.9 m, in flat reaches of the valley floor.
- D8 flow direction (ESRI scheme) and flow accumulation (O’Callaghan & Mark, 1984).
- Watershed = cells draining to the final point (10 m); polygon obtained by vectorizing the mask.
- Channel initiation. The manual’s criterion (a = b on the contour lines) cannot be resolved by a 30 m DEM: the b/a ratio measured along the thalweg reaches at most 0.97 (median 0.25). A contributing-area threshold of 1 ha was adopted, calibrated on Appendix A of the manual (Nova Friburgo).
- Strahler order (Strahler, 1957) of the watershed network and zero-order thalwegs (headwater hollows, from the head of the first-order channels up to the divide, and convergent side valleys).
| Metric | Value |
|---|---|
| Area / perimeter | 3.108 km² / 9.92 km |
| Compactness coefficient Kc / form factor Kf | 1.57 / 0.41 |
| Minimum / mean / maximum elevation | 982 / 1,336 / 1,769 m |
| Mean watershed slope; fraction > 30° | 22.3° (43.3%); 20.8% |
| Main thalweg (longest D8 flow path) | 2,748 m, from 1,762 to 982 m; S = 0.284 m/m (15.9°) |
| Time of concentration: Kirpich / Giandotti / Ven Te Chow | 14.1 / 44.5 / 27.5 min |
| Network (1 ha threshold): channel heads, maximum order | 101 channel heads; order 5 |
| Ldy11 (orders ≥ 1) / Ldy12 (zero order) | 23,434 m / 35,681 m (131 thalwegs) |
| Drainage density | 7.54 km/km² |
| 2011 scars in the watershed (original inventory) | 54 polygons; 159,643 m² (5.1% of the area) |
| Strahler order | Length (m) |
|---|---|
| 1 | 13,258 |
| 2 | 5,561 |
| 3 | 2,497 |
| 4 | 1,803 |
| 5 | 314 |
| 0 (zero-order thalwegs) | 35,681 |
The network length depends strongly on the threshold (Table 7.7): between 1 and 5 ha, Ldy11 drops by a factor of ~2.5, whereas Ldy11 + Ldy12 varies much less, because the length “migrates” to the zero order. D8 also generates parallel lines on planar slopes, inflating channel heads and orders (order 5 in a 3 km² watershed) — a limitation that weighs on the traditional method (Section 7.7).
| Threshold (ha) | Channel heads | Max. order | Ldy11 (m) | Ldy12 (m) | Density (km/km²) |
|---|---|---|---|---|---|
| 0.25 | 445 | 6 | 59,919 | 82,211 | 19.28 |
| 0.50 | 208 | 5 | 36,137 | 48,958 | 11.63 |
| 1.00 | 101 | 5 | 23,434 | 35,681 | 7.54 |
| 2.00 | 44 | 4 | 14,139 | 32,791 | 4.55 |
| 3.00 | 31 | 4 | 11,717 | 33,934 | 3.77 |
| 5.00 | 17 | 4 | 9,336 | 31,905 | 3.00 |
7.5 Design rainfall
7.5.1 Rain gauges and selection
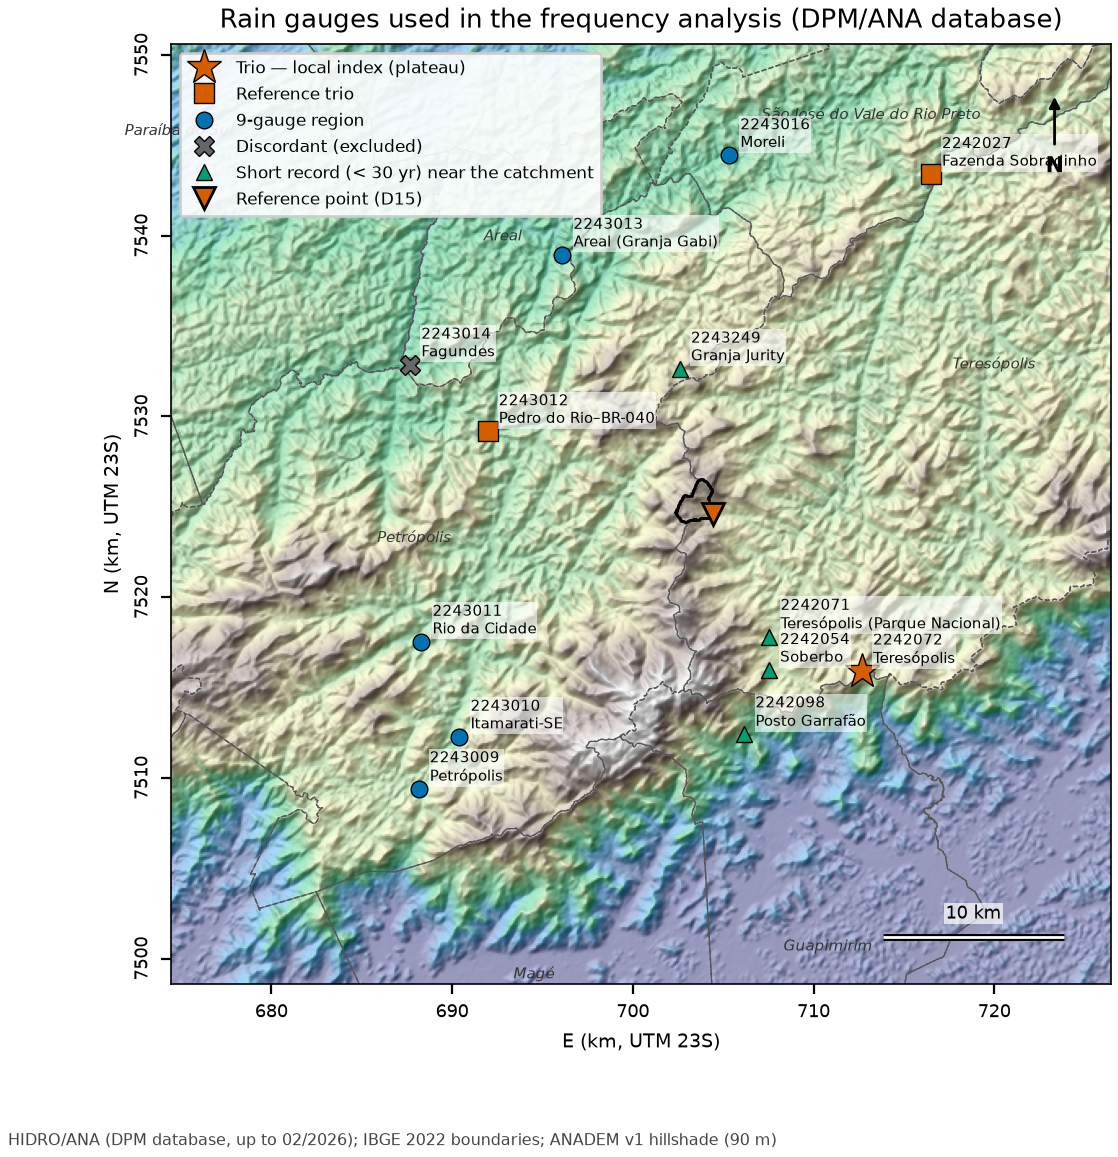
The DPM database (ANA’s HIDRO, updated through 02/2026) has 139 rain gauges within 40 km of the point, but only 23 with 30 or more years of valid data (report 06). For Teresópolis, the rainfall study proposed a reference trio (Table 7.8, Figure 7.13):
- 2242072 Teresópolis (INMET) — the only long record on the plateau (874 m; 12.0 km to the SE), with 63 valid years between 1914 and 2011, but discontinued in 06/2012;
- 2243012 Pedro do Rio–BR-040 — the closest gauge with a current record (13.3 km), but in the Piabanha valley (645 m), on the leeward side;
- 2242027 Fazenda Sobradinho — the longest record in the region (89 years), 22.3 km away, also on the leeward side.
The orographic gradient is strong and there is no single “right” gauge: the analysis therefore combines the trio (regional L-moment analysis), checks the choice against a larger region and against the plateau gauges, and uses the short-record gauges closest to the watershed (Parque Nacional, Soberbo, Granja Jurity) to size the uncertainty envelope.
| Code | Gauge | Operator | Dist. (km) | Elev. inventory / ANADEM (m) | Period | Valid years (≤ 10%) | Gaps (%) | Role |
|---|---|---|---|---|---|---|---|---|
| 2242072 | Teresópolis | INMET | 12.0 | 874 / 1,249 | 07/1913–06/2012 | 63 | 27.4 | trio (local index) |
| 2243012 | Pedro do Rio–BR-040 | SGB-CPRM | 13.3 | 645 / 685 | 11/1938–02/2026 | 87 | 0.2 | trio |
| 2242027 | Fazenda Sobradinho | SGB-CPRM | 22.3 | 650 / 796 | 05/1936–12/2025 | 89 | 0.2 | trio |
| 2243013 | Areal (Granja Gabi) | SGB-CPRM | 16.6 | 450 / 476 | 04/1939–02/2026 | 85 | 1.1 | 9-gauge region |
| 2243011 | Rio da Cidade | SGB-CPRM | 17.6 | 704 / 745 | 07/1938–02/2026 | 85 | 0.4 | 9-gauge region |
| 2243010 | Itamarati-SE | SGB-CPRM | 18.7 | 1,085 / 778 | 07/1938–01/2026 | 87 | 0.2 | 9-gauge region |
| 2243016 | Moreli | SGB-CPRM | 19.9 | 600 / 512 | 01/1955–02/2026 | 71 | 0.2 | 9-gauge region |
| 2243009 | Petrópolis | ANA | 22.3 | 890 / 822 | 05/1938–12/2007 | 58 | 11.3 | 9-gauge region |
| 2242026 | Bom Sucesso | SGB-CPRM | 25.2 | 870 / 871 | 11/1965–02/2026 | 59 | 1.0 | 9-gauge region |
| 2243014 | Fagundes | SGB-CPRM | 18.7 | 460 / 506 | 07/1938–02/2026 | 83 | 3.2 | discordant |
| 2242071 | Teresópolis (Parque Nacional) | INMET | 7.5 | 980 / 935 | 01/1961–12/1980 | 12 | 29.0 | short (< 30 years) |
| 2242054 | Soberbo | DNOS | 9.2 | 1,004 / 931 | 01/1936–04/1956 | 10 | 44.8 | short (< 30 years) |
| 2243249 | Granja Jurity | INMET | 8.3 | 980 / 1,161 | 01/1986–12/1998 | 12 | 2.0 | short (< 30 years) |
| 2242098 | Posto Garrafão | INEA-RJ | 12.3 | 640 / 658 | 09/1977–12/1994 | 16 | 2.7 | short (< 30 years) |
7.5.2 Annual-maximum series and quality control
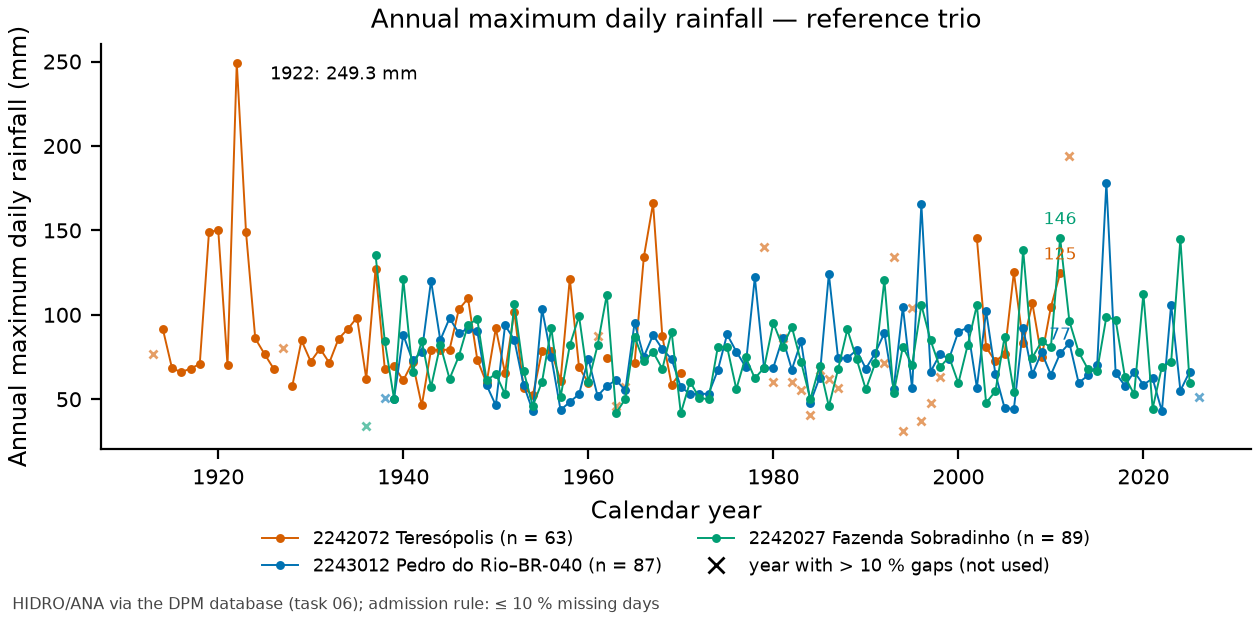
Annual maximum daily rainfalls were extracted for the calendar year (as in the manual) and for the water year (Oct–Sep). A year enters the analysis if it has at most 10% of days without data (rule of report 06, equivalent to the practice of Appendix A). Maxima with ANA status 3 (doubtful) or 4 (accumulated) are flagged but not discarded: there are none in the at-site series of 2242072; the regional analyses include four — the 2024 maximum at Fazenda Sobradinho (144.9 mm, doubtful and the second largest of its record, in the trio and in the 9-gauge region), the 2023 and 2024 maxima at Itamarati-SE (doubtful) and the 1999 maximum at Bom Sucesso (accumulated), these three in the 9-gauge region and on the plateau (report 06, §3; chuva/maximas_anuais.csv). Figure 7.14 shows the three series. Three points deserve attention at the plateau gauge:
- Long gaps — there are no data in 1971–1978, 1988–1991 and 1999–2001; the years 1913, 1927, 1961, 1963–1964, 1979–1987, 1992–1998 and 2012 have more than 10% missing data and are excluded. The valid series has 63 years: 1914–1926, 1928–1960, 1962, 1965–1970 and 2002–2011.
- A very wet early period — in the complete years, the mean annual total was 2,586 mm in 1914–1927 (10 years) versus 1,713 mm from 1928 onward (41 years); 5 of the early years exceed 2,500 mm (maximum of 3,916 mm in 1919). The Mann-Kendall test is significant for the annual totals (Z = −2.31; p = 0.021; −44.7 mm/decade; report 06) but not for the maxima (Z = 0.63; p = 0.53). Four of the 5 largest valid maxima occurred in 1919–1923, including the series maximum: 249.3 mm on March 31, 1922 — a possible inhomogeneity that cannot be tested against neighboring gauges (their records begin in 1936–1939).
- Incomplete 2012 — the series ends on June 30, 2012; that year has 194.0 mm on April 7, 2012 (the 24-h record of the INMET 1991–2020 climate normal; JICA, 2026), but it is excluded by the 10% rule.
7.5.3 Frequency analysis
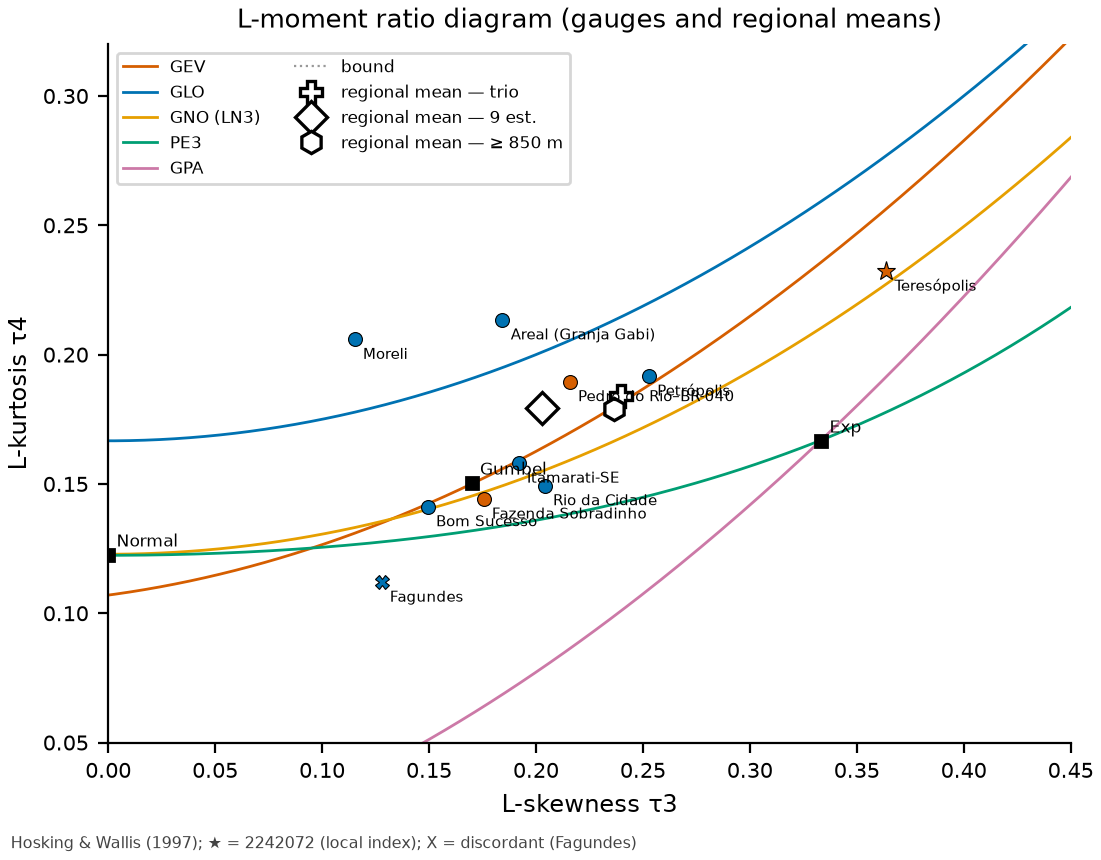
At-site analysis. At each gauge, trigrs_mapper.hydro.frequencia was used to fit the manual’s Gumbel distribution (method of moments, \(\alpha = 0.779\,s\); \(\beta = \bar x - 0.577\,\alpha\)), the 2-parameter Exponential (the manual’s criterion for skewness \(g > 1.5\)), and GEV, Pearson III, log-Pearson III and 2- and 3-parameter lognormal distributions by moments, L-moments and maximum likelihood (ML). Goodness of fit was measured by the Kolmogorov-Smirnov, Anderson-Darling, chi-square and PPCC tests, with p-values from a parametric bootstrap (each simulated sample is refitted; Stephens, 1974); the “modern” choice uses the lowest AIC among the ML candidates, checked on the L-moment ratio diagram (Figure 7.15).
At the plateau gauge: \(n\) = 63, \(\bar x\) = 88.65 mm, \(s\) = 34.17 mm, \(g\) = 2.22 and L-skewness \(\tau_3\) = 0.364. By the manual’s criterion (\(g > 1.5\)) the distribution would be the Exponential; by AIC, the GEV (Akaike weights: GEV 0.46, LP3 0.26, LN3 0.23); on the L-moment ratio diagram, the closest curve is LN3. The manual’s Gumbel (whose 100-year daily rainfall is P100 = 195.7 mm) is rejected at the 5% level by the three tests with simulated p-values (KS p = 0.020; Anderson-Darling p = 0.010; PPCC p = 0.020), and the ML Gumbel lies 6.7 AIC units above the GEV (Table 7.9).
| Distribution | Method | AIC | KS p | AD p | PPCC r | P100 (mm) | P200 (mm) |
|---|---|---|---|---|---|---|---|
| Gumbel | moments (manual) | 599.7 | 0.02 | ≤ 0.01 | 0.957 | 195.7 | 214.2 |
| Exponential 2P | moments | — | 0.33 | 0.42 | 0.982 | 211.8 | 235.5 |
| GEV | L-moments | 586.7 | 0.47 | 0.38 | 0.990 | 233.9 | 282.1 |
| GEV | ML | 586.3 | 0.23 | 0.20 | 0.989 | 225.1 | 267.0 |
| LN3 | L-moments | — | 0.20 | 0.13 | 0.989 | 228.1 | 266.2 |
| LN3 | ML | 587.7 | 0.11 | 0.06 | 0.982 | 203.0 | 229.1 |
| LP3 | L-moments | — | 0.11 | 0.18 | 0.989 | 235.9 | 279.9 |
| LP3 | ML | 587.4 | 0.15 | 0.08 | 0.984 | 206.5 | 235.8 |
| PE3 | ML | 591.6 | 0.05 | 0.03 | 0.967 | 186.2 | 202.7 |
| LN2 | ML | 595.9 | ≤ 0.01 | ≤ 0.01 | 0.950 | 175.1 | 189.5 |
| Gumbel | ML | 593.0 | ≤ 0.01 | ≤ 0.01 | 0.957 | 169.4 | 183.6 |
The heavy-tailed distributions fitted to this series alone are unstable: Table 7.10 shows that removing a single year (1922) changes the GEV-ML P100 from 225 to 196 mm, and that the water year raises the GEV-ML P100 to 261 mm. This calls for an estimate of the shape of the distribution based on more information than 63 years at a single gauge.
| Sample | n | x̄ (mm) | g | τ3 | Gumbel P100 | GEV-ML P100 | LN3-ML P100 | LP3-ML P100 | Lowest AIC |
|---|---|---|---|---|---|---|---|---|---|
| base (≤ 10% gaps; 1914–2011) | 63 | 88.7 | 2.22 | 0.364 | 196 | 225 | 203 | 207 | GEV |
| without 1922 (249.3 mm) | 62 | 86.1 | 1.24 | 0.301 | 172 | 196 | 182 | 185 | GEV |
| 1928 onward | 50 | 84.4 | 1.21 | 0.260 | 165 | 178 | 172 | 174 | Gumbel |
| 1936 onward | 42 | 85.2 | 1.13 | 0.268 | 171 | 194 | 183 | 187 | Gumbel |
| with partial 2012 (194.0 mm on Apr 7) | 64 | 90.3 | 2.07 | 0.377 | 204 | 243 | 215 | 220 | GEV |
| manual rule (no gaps in Oct–Mar) | 54 | 88.7 | 2.28 | 0.361 | 199 | 228 | 208 | 212 | GEV |
| complete years only | 51 | 88.4 | 2.39 | 0.386 | 200 | 224 | 204 | 207 | GEV |
| water year (Oct–Sep) | 61 | 91.7 | 2.21 | 0.377 | 198 | 261 | 229 | 234 | LP3 |
The other two gauges of the trio are well behaved (Table 7.11): moderate skewness, Gumbel close to the best distribution and P100 of ~150 mm — about 25% below the plateau, reflecting their leeward position.
| Gauge | Year | n | x̄ (mm) | s (mm) | g | τ3 | Gumbel P100 | Lowest AIC | P100 (lowest AIC) | P200 (lowest AIC) |
|---|---|---|---|---|---|---|---|---|---|---|
| 2242072 Teresópolis | calendar | 63 | 88.7 | 34.2 | 2.22 | 0.364 | 196 | GEV-ML | 225 | 267 |
| 2242072 Teresópolis | water | 61 | 91.7 | 33.8 | 2.21 | 0.377 | 198 | LP3-ML | 234 | 276 |
| 2243012 Pedro do Rio–BR-040 | calendar | 87 | 74.8 | 23.8 | 1.76 | 0.216 | 149 | PE3-ML | 150 | 163 |
| 2243012 Pedro do Rio–BR-040 | water | 86 | 75.1 | 24.0 | 1.68 | 0.197 | 150 | Gumbel-ML | 144 | 156 |
| 2242027 Fazenda Sobradinho | calendar | 89 | 76.7 | 23.3 | 0.97 | 0.175 | 150 | PE3-ML | 152 | 164 |
| 2242027 Fazenda Sobradinho | water | 89 | 77.7 | 23.0 | 1.02 | 0.197 | 150 | Gumbel-ML | 149 | 162 |
Regional L-moment analysis. The index-flood method (Hosking & Wallis, 1997) assumes that the gauges of a homogeneous region share the same growth curve \(q(F)\) and differ only by a scale factor (the index \(\mu_i\), here the mean of the annual maxima): \(Q_i(T) = \mu_i \, q(1 - 1/T)\). The regional L-moment ratios are averages weighted by record length; homogeneity is tested by the \(H_1\) measure (dispersion of the L-CV compared with 500 homogeneous regions simulated with a Kappa distribution), the discordancy of each gauge by \(D_i\), and the regional distribution by the \(Z^{\text{DIST}}\) measure (\(|Z| \le 1.64\) accepts). Three regions were tested: the trio, the 9 gauges on the back slope (reverso) of the Serra dos Órgãos (within about 25 km of the point — the farthest, Bom Sucesso, is 25.2 km away; ≥ 400 m; ≥ 30 years; excluding the discordant Fagundes gauge, \(D\) = 2.65 > 2.491) and the plateau (inventory elevation ≥ 850 m; by the ANADEM elevation, Itamarati-SE and Petrópolis lie below that, Table 7.8).
| Gauge | n | x̄ (mm) | L-CV t | τ3 | τ4 | D_i |
|---|---|---|---|---|---|---|
| 2242072 Teresópolis | 63 | 88.7 | 0.188 | 0.364 | 0.232 | 2.15 |
| 2243012 Pedro do Rio–BR-040 | 87 | 74.8 | 0.164 | 0.216 | 0.190 | 0.22 |
| 2243013 Areal (Granja Gabi) | 85 | 73.8 | 0.184 | 0.184 | 0.213 | 0.81 |
| 2243011 Rio da Cidade | 85 | 84.7 | 0.180 | 0.204 | 0.149 | 0.28 |
| 2243010 Itamarati-SE | 87 | 89.9 | 0.181 | 0.192 | 0.158 | 0.08 |
| 2243016 Moreli | 71 | 77.5 | 0.181 | 0.115 | 0.206 | 1.82 |
| 2243009 Petrópolis | 58 | 104.2 | 0.178 | 0.253 | 0.192 | 0.22 |
| 2242027 Fazenda Sobradinho | 89 | 76.7 | 0.167 | 0.175 | 0.144 | 0.46 |
| 2242026 Bom Sucesso | 59 | 68.2 | 0.148 | 0.149 | 0.141 | 1.31 |
| 2243014 Fagundes | 83 | 63.3 | 0.234 | 0.128 | 0.112 | 2.65 |
| Region | N | Station-years | t_R | τ3_R | τ4_R | H1 | Z GEV | Z GLO | Z GNO | Z PE3 | q(100) | P100 (mm) |
|---|---|---|---|---|---|---|---|---|---|---|---|---|
| Reference trio (chosen) | 3 | 239 | 0.171 | 0.240 | 0.184 | −0.38 | −0.13 | 0.86 | −0.55 | −1.30 | 2.162 | 191.7 |
| 9 back-slope gauges | 9 | 684 | 0.175 | 0.203 | 0.179 | −1.04 | −0.97 | 1.18 | −1.48 | −2.56 | 2.091 | 185.4 |
| Plateau ≥ 850 m | 4 | 267 | 0.175 | 0.236 | 0.179 | 0.04 | −0.07 | 1.01 | −0.49 | −1.27 | 2.174 | 192.8 |
Pd(TR) is the design maximum daily rainfall for the return period TR (from the Portuguese tempo de retorno). Regional L-moment analysis (index flood; Hosking & Wallis, 1997): the GEV growth curve of the reference trio (homogeneous, \(H_1\) = −0.38; GEV with the smallest \(|Z|\) = −0.13) multiplied by the local index of the plateau gauge (\(\mu\) = 88.65 mm, \(n\) = 63). Growth-curve parameters: \(\xi\) = 0.8460, \(\alpha\) = 0.2222, \(k\) = −0.1058 (Hosking’s parameterization). Why:
- the point (982 m) and the watershed (982–1,769 m) lie on the plateau/back slope of the Serra dos Órgãos; of the three reference records, only 2242072 (874 m, 12 km) is on the Teresópolis plateau — it sets the level (index) of the local rainfall;
- at 2242072 the skewness is high (g = 2.22 > 1.5 → Exponential by the manual’s criterion) and AIC rejects the Gumbel (ΔAIC ≈ 6.7); the 3-parameter distributions fitted to this series alone have an unstable tail: removing the year 1922 (249.3 mm) reduces the GEV-ML P100 from 225 to 196 mm (−13%);
- the trio is homogeneous (H1 < 1) and the GEV has the smallest |Z|; the regional shape (239 station-years) is robust to a single year, and the local index preserves the orographic gradient;
- the result lies between the alternative regions (9 gauges: −3%; plateau ≥ 850 m: +1% in P100), consistent with the at-site Gumbel (196 mm) and with JICA (199 mm, gauge 2242071).
| TR (years) | Adopted Pd (mm) | 90% CI (mm) | P24h = 1.13·Pd (mm) | Gumbel 2242072 | GEV-ML 2242072 | Regional 9 gauges | Regional plateau | Pedro do Rio | Faz. Sobradinho | Orographic envelope |
|---|---|---|---|---|---|---|---|---|---|---|
| 2 | 82.4 | 77–90 | 93.1 | 83 | 80 | 83 | 82 | 70 | 72 | 67–113 |
| 5 | 107.0 | 98–117 | 120.9 | 113 | 105 | 108 | 107 | 91 | 94 | 87–147 |
| 10 | 125.0 | 114–137 | 141.3 | 133 | 126 | 126 | 126 | 106 | 109 | 101–171 |
| 25 | 150.0 | 133–165 | 169.5 | 158 | 160 | 149 | 151 | 124 | 126 | 122–205 |
| 50 | 170.1 | 148–189 | 192.3 | 177 | 190 | 167 | 171 | 137 | 139 | 138–233 |
| 100 | 191.7 | 163–217 | 216.6 | 196 | 225 | 185 | 193 | 150 | 152 | 155–262 |
| 200 | 214.8 | 178–247 | 242.8 | 214 | 267 | 204 | 216 | 163 | 164 | 174–294 |
| 500 | 248.1 | 198–293 | 280.3 | 239 | 334 | 231 | 249 | 179 | 180 | 201–340 |
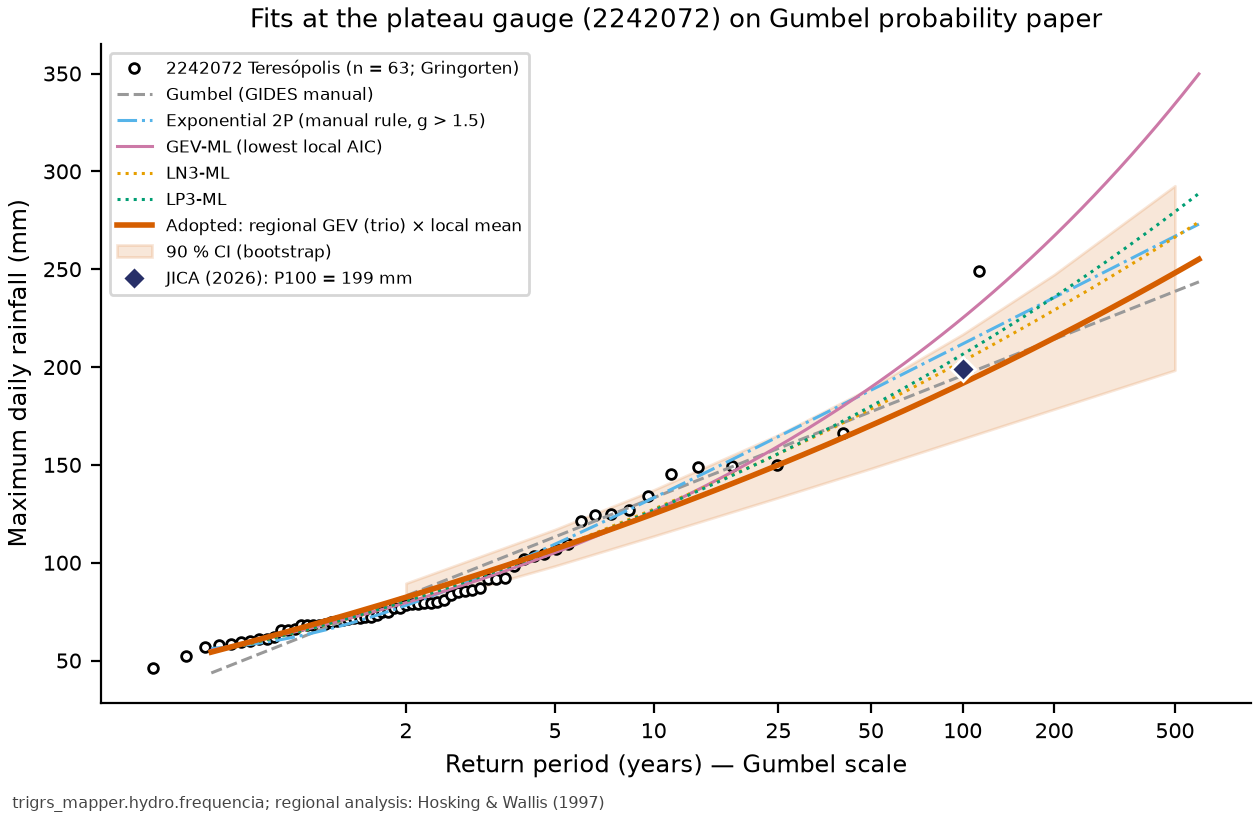
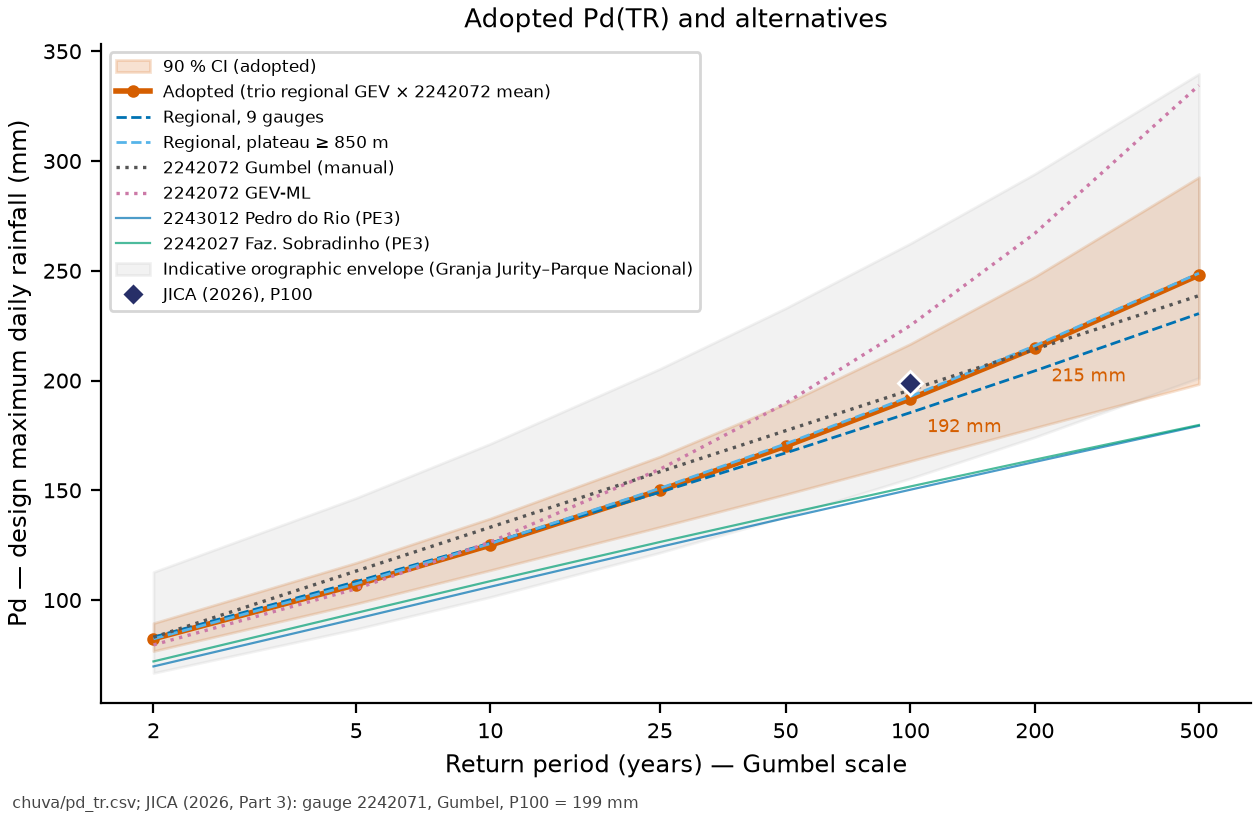
Comparison with the official design. JICA (2026, Part 3) adopted P100 = 199 mm (Gumbel, gauge identified as 2242071, \(n\) = 100, \(\bar x\) = 81.69 mm, \(s\) = 37.46 mm, \(g\) = 1.43). The Pd adopted here gives P100 = 191.7 mm (−3.7%), and the manual’s Gumbel at 2242072 gives 195.7 mm. In the DPM database, code 2242071 (Teresópolis–Parque Nacional) has only 12 valid years (1961–1976), with a mean of 134.8 mm — JICA’s series could not be reproduced. (For methodological reference, Appendix A of the manual uses P100 = 175 mm and P200 = 191 mm at Cascatinha do Cônego, Nova Friburgo.)
The short-record gauges closest to the watershed show the size of the orographic gradient. In the years they share, the maxima at Parque Nacional (2242071, 7.5 km SSE) were 1.37× those at Teresópolis (7 years) and those at Soberbo (2242054) 1.76× (10 years); Granja Jurity (2243249, 8.3 km NNW), in turn, recorded 0.96× Pedro do Rio (12 years). Applying these ratios to the index, the indicative P100 ranges from 155 mm (back slope, to the north) to 262 mm (escarpment, to the south). The watershed (982–1,769 m) lies between these gauges; the adopted Pd is in the middle of the envelope, but the extreme rainfall at the headwaters may be larger — a subject for the sensitivity analysis.
7.5.4 IDF (DAEE/CETESB and Sherman)
The 24-h rainfall is \(P_{24h} = 1.13 \, P_{1\,day}\) — the empirical factor of TP-40 (Hershfield, 1961), standard at DPM and in IDF-MC (the SEDEC/MIDR portal of IDF curves under climate change); Weiss (1964) obtained ≈ 1.14 (8/7) theoretically, and DAEE/CETESB (1980) adopt 1.14. The depths for shorter durations follow the DAEE/CETESB (1980) cascade (DAEE: São Paulo State Department of Water and Electric Energy; CETESB: São Paulo State Environmental Company): 1 h/24 h = 0.42; 30 min/1 h = 0.74; 5, 10, 15, 20 and 25 min over 30 min = 0.34, 0.54, 0.70, 0.81 and 0.91; 6, 8, 10 and 12 h over 24 h = 0.72, 0.78, 0.82 and 0.85. The Sherman equation fitted to the 8 TRs × 12 durations is
with R² = 0.9972, RMSE = 4.44 mm/h and a mean relative error of 3.3% (maximum of 8.5%); the intensity increases with TR and decreases with duration over the whole range (monotonicity check).
| Duration (min) | TR 2 | TR 5 | TR 10 | TR 25 | TR 50 | TR 100 | TR 200 | TR 500 |
|---|---|---|---|---|---|---|---|---|
| 5 | 118.0 | 153.3 | 179.2 | 214.9 | 243.8 | 274.7 | 307.8 | 355.5 |
| 10 | 93.7 | 121.8 | 142.3 | 170.7 | 193.6 | 218.1 | 244.5 | 282.3 |
| 15 | 81.0 | 105.2 | 123.0 | 147.5 | 167.3 | 188.5 | 211.3 | 244.0 |
| 20 | 70.3 | 91.3 | 106.7 | 128.0 | 145.2 | 163.6 | 183.3 | 211.7 |
| 25 | 63.2 | 82.1 | 95.9 | 115.0 | 130.5 | 147.0 | 164.8 | 190.3 |
| 30 | 57.9 | 75.2 | 87.8 | 105.3 | 119.5 | 134.7 | 150.9 | 174.3 |
| 60 | 39.1 | 50.8 | 59.3 | 71.2 | 80.7 | 91.0 | 102.0 | 117.7 |
| 360 | 11.2 | 14.5 | 17.0 | 20.3 | 23.1 | 26.0 | 29.1 | 33.6 |
| 480 | 9.1 | 11.8 | 13.8 | 16.5 | 18.7 | 21.1 | 23.7 | 27.3 |
| 600 | 7.6 | 9.9 | 11.6 | 13.9 | 15.8 | 17.8 | 19.9 | 23.0 |
| 720 | 6.6 | 8.6 | 10.0 | 12.0 | 13.6 | 15.3 | 17.2 | 19.9 |
| 1,440 | 3.9 | 5.0 | 5.9 | 7.1 | 8.0 | 9.0 | 10.1 | 11.7 |
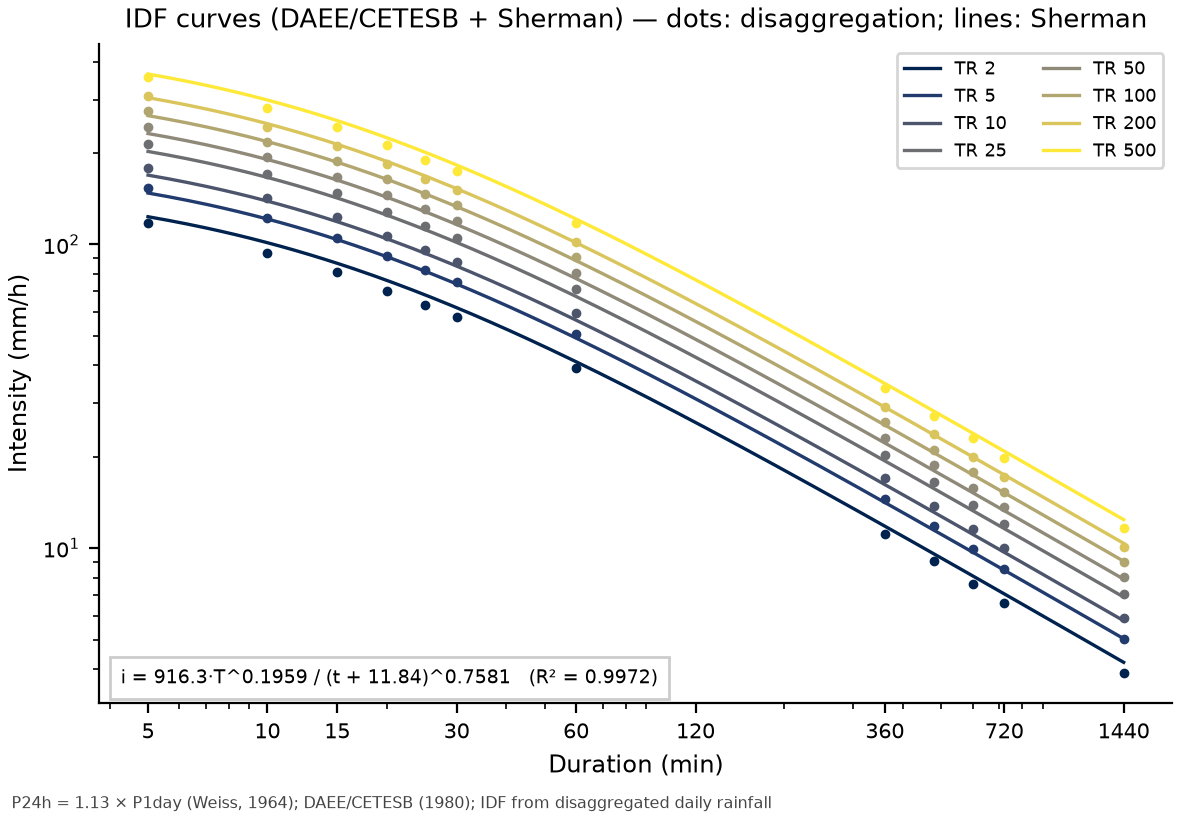
An IDF derived from disaggregated daily rainfall does not replace an IDF from recording rain gauges: the DAEE/CETESB ratios are national averages and do not necessarily represent the short-duration rainfall of the convective cells over the mountains.
7.5.5 Design hyetograph (alternating block method)
For TRIGRS, the design rainfall is a 24-h hyetograph with a 1-h time step. The depth–duration curve \(P(d)\) is that of the DAEE/CETESB disaggregation, interpolated on a log-log scale between the nodes (so the 24-h total is exactly \(P_{24h}\) and the wettest hour is exactly \(0.42 \, P_{24h}\)). The alternating block method (Chow, Maidment & Mays, 1988) has four steps:
- compute \(P(k \, \Delta t)\) for \(k\) = 1…24;
- obtain the increments \(\Delta P_k = P(k\,\Delta t) - P((k-1)\,\Delta t)\);
- place the largest increment in the central block (the \(\lceil N/2 \rceil\)-th, i.e., the 12th block, from 11 to 12 h);
- distribute the remaining ones, in decreasing order, alternately to the right and to the left.
For TR = 100 years, \(P_{24h}\) = 1.13 × 191.7 = 216.6 mm (Table 7.16):
| k | Duration d (h) | P(d) (mm) | ΔP_k (mm) | Position in the hyetograph (h) | Intensity (mm/h) |
|---|---|---|---|---|---|
| 1 | 1 | 91.0 | 91.0 | 11–12 | 91.0 |
| 2 | 2 | 112.1 | 21.1 | 12–13 | 21.1 |
| 3 | 3 | 126.6 | 14.5 | 10–11 | 14.5 |
| 4 | 4 | 138.1 | 11.4 | 13–14 | 11.4 |
| 5 | 5 | 147.6 | 9.6 | 9–10 | 9.6 |
| 6 | 6 | 156.0 | 8.3 | 14–15 | 8.3 |
| 7 | 7 | 162.8 | 6.8 | 8–9 | 6.8 |
| 8 | 8 | 169.0 | 6.2 | 15–16 | 6.2 |
| 9 | 9 | 173.5 | 4.5 | 7–8 | 4.5 |
| 10 | 10 | 177.6 | 4.1 | 16–17 | 4.1 |
| 11 | 11 | 181.0 | 3.4 | 17–18 | 3.4 |
| 12 | 12 | 184.1 | 3.1 | 18–19 | 3.1 |
| 13 | 13 | 187.6 | 3.5 | 6–7 | 3.5 |
| 14 | 14 | 190.9 | 3.3 | 5–6 | 3.3 |
| 15 | 15 | 194.0 | 3.1 | 4–5 | 3.1 |
| 16 | 16 | 197.0 | 3.0 | 19–20 | 3.0 |
| 17 | 17 | 199.8 | 2.8 | 3–4 | 2.8 |
| 18 | 18 | 202.5 | 2.7 | 20–21 | 2.7 |
| 19 | 19 | 205.1 | 2.6 | 2–3 | 2.6 |
| 20 | 20 | 207.6 | 2.5 | 21–22 | 2.5 |
| 21 | 21 | 210.0 | 2.4 | 1–2 | 2.4 |
| 22 | 22 | 212.3 | 2.3 | 22–23 | 2.3 |
| 23 | 23 | 214.5 | 2.2 | 0–1 | 2.2 |
| 24 | 24 | 216.6 | 2.2 | 23–24 | 2.2 |
The peak is 91.0 mm/h (2.53 × 10⁻⁵ m/s, the TRIGRS unit) between 11 and 12 h. The hyetographs of all TRs (2 to 500 years) and scenarios are in chuva/hietogramas_projeto.csv; the present-climate 24-h totals range from 93 mm (TR 2) to 280 mm (TR 500), with peaks from 39 to 118 mm/h.
scripts/casos/teresopolis/03_idf_hietogramas_clima.py (excerpt)
from trigrs_mapper.hydro import (tabela_idf, ajustar_sherman, altura_duracao_daee_cetesb,
                                 hietograma_blocos_alternados)
pd_obs = {2: 82.4, 5: 107.0, 10: 125.0, 25: 150.0, 50: 170.1, 100: 191.7, 200: 214.8, 500: 248.1}  # chuva/pd_tr.csv
tab = tabela_idf(pd_obs, metodo="daee_cetesb", fator_24h=1.13)  # depths and intensities
sherman = ajustar_sherman(tab)                                    # K, a, b, c, R², RMSE
p24 = 1.13 * pd_obs[100]
h = hietograma_blocos_alternados(altura_duracao_daee_cetesb(p24), duracao_minutes=1440, dt_minutes=60)
print(h.total_mm, h.intensidade_mm_h.max(), h.intensidade_m_s.max())   # mm, mm/h, m/s
7.5.6 SCS-CN and design hydrograph
Curve Number. The BHAE 2022 unit (ANA’s Otto-coded hydrographic base by elementary catchment) that contains the point (Otto code 77878674, 12.16 km²) covers 99.1% of the watershed; the CN for antecedent moisture condition II (AMC II) of the ANA methodology in that unit (table bhae.bhae_cn2022, skill dpm-bhae-postgis) is CN = 69.0 (median 65; minimum 65; maximum 98; 14,620 pixels). The cross-check with land use uses the TR-55 table (USDA-SCS, 1986) and the hydrologic soil group: map unit CXbd32 is a Haplic Cambisol of medium and clayey texture, group C in the classification of Sartori et al. (2005) (group D for the shallow/rocky phases). With the 2015 MapBiomas cover in the watershed (Table 7.17), the TR-55 CN would be 70.3 (group C) or 77.2 (group D); the global product also stored in the BHAE gives 77.7. The BHAE value is consistent with a forested watershed on group C soil.
| MapBiomas C11 class | 2015 (%) | 2025 (%) |
|---|---|---|
| Forest Formation | 95.6 | 99.2 |
| Mosaic of Uses | 4.3 | 0.8 |
| Pasture | 0.1 | — |
With \(S = 25400/CN - 254\) = 114.2 mm and \(I_a = 0.2\,S\) = 22.8 mm, the cumulative effective rainfall is \(Q = (P - I_a)^2/(P - I_a + S)\) for \(P > I_a\). For the wet antecedent condition (AMC III; Chow et al., 1988), \(CN_{III} = 23\,CN_{II}/(10 + 0.13\,CN_{II})\) = 83.7.
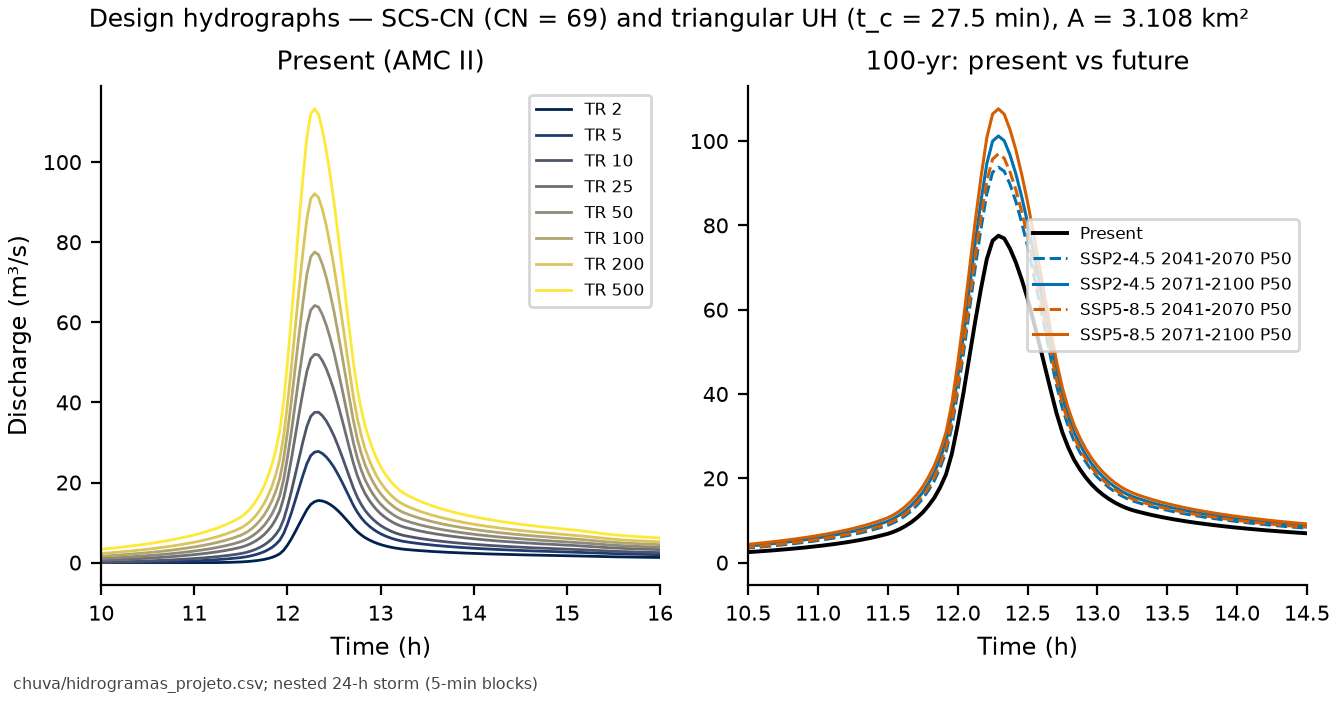
SCS triangular unit hydrograph. With \(t_c\) = 27.5 min (Ven Te Chow, the intermediate value of the three formulas in Table 7.5; Kirpich was derived for small agricultural watersheds and Giandotti for large basins, the latter tending to overestimate \(t_c\) in small, steep watersheds — Silveira, 2005 — and both are kept as sensitivity cases), \(t_{lag} = 0.6\,t_c\), \(t_p = \Delta t/2 + t_{lag}\), \(t_b = 2.67\,t_p\) and \(q_p = 0.208\,A\,P_e/t_p\). Because \(t_c\) is short, the hydrograph uses the nested 24-h storm (the same \(P_{24h}\) and the same depth–duration curve as the TRIGRS hyetographs), in 5-min alternating blocks subdivided into 2.5 min for the convolution (Δt ≤ 0.25 \(t_p\)). Table 7.18 summarizes the results (AMC II).
| TR (years) | P24h (mm) | Pe (mm) | C = Pe/P | Qp (m³/s) | t_peak (h) | Volume (10³ m³) |
|---|---|---|---|---|---|---|
| 2 | 93.1 | 26.8 | 0.29 | 15.5 | 12.33 | 83 |
| 5 | 120.9 | 45.3 | 0.37 | 27.8 | 12.33 | 141 |
| 10 | 141.3 | 60.3 | 0.43 | 37.6 | 12.33 | 188 |
| 25 | 169.5 | 82.4 | 0.49 | 52.0 | 12.29 | 256 |
| 50 | 192.3 | 101.2 | 0.53 | 64.2 | 12.29 | 315 |
| 100 | 216.6 | 122.0 | 0.56 | 77.6 | 12.29 | 379 |
| 200 | 242.8 | 144.8 | 0.60 | 92.1 | 12.29 | 450 |
| 500 | 280.3 | 178.4 | 0.64 | 113.3 | 12.29 | 555 |
The TR 100 peak discharge is 77.6 m³/s; JICA (2026, Part 3) gives Q = 59.0 m³/s for the water discharge in the official design. Table 7.19 shows the sensitivity to \(t_c\), to antecedent moisture, to the hourly discretization used in TRIGRS and to the DPM legacy workflow (duration equal to \(t_c\); Silveira, 2000).
| Variant | TR | Qp (m³/s) | Δ vs. central (%) |
|---|---|---|---|
| AMC III (CN = 83.7) | 10 | 60.3 | +61 |
| AMC III (CN = 83.7) | 100 | 103.4 | +33 |
| AMC III (CN = 83.7) | 200 | 118.3 | +28 |
| Kirpich t_c (14.1 min) | 10 | 49.4 | +31 |
| Kirpich t_c (14.1 min) | 100 | 102.2 | +32 |
| Kirpich t_c (14.1 min) | 200 | 121.4 | +32 |
| Giandotti t_c (44.5 min) | 10 | 29.4 | −22 |
| Giandotti t_c (44.5 min) | 100 | 60.7 | −22 |
| Giandotti t_c (44.5 min) | 200 | 72.1 | −22 |
| DPM legacy (duration = t_c; Silveira 2000) | 10 | 6.2 | −83 |
| DPM legacy (duration = t_c; Silveira 2000) | 100 | 22.8 | −71 |
| DPM legacy (duration = t_c; Silveira 2000) | 200 | 30.2 | −67 |
| hourly hyetograph (TRIGRS), Δt = 60 min | 10 | 21.9 | −42 |
| hourly hyetograph (TRIGRS), Δt = 60 min | 100 | 46.5 | −40 |
| hourly hyetograph (TRIGRS), Δt = 60 min | 200 | 55.5 | −40 |
The legacy workflow (rainfall with duration equal to \(t_c\)) gives much smaller discharges because the TR 100 rainfall over that duration (68.1 mm in 29.2 min: \(t_c\) rounded up to 8 steps of Δt = 0.133 \(t_c\) = 3.65 min) produces only 12.9 mm of effective rainfall: the initial abstraction (\(I_a\) = 22.8 mm) and the potential retention (\(S\) = 114.2 mm) absorb most of it. In the nested storm, the hours before the peak have already satisfied \(I_a\) and much of the retention, so that most of the intense peak rainfall runs off. The hourly TRIGRS hyetograph, in turn, dilutes the peak into 1-h blocks (Qp = 46.5 m³/s): it serves infiltration in the stability model, not the computation of the peak discharge.
scripts/casos/teresopolis/04_cn_hidrograma.py (excerpt)
from trigrs_mapper.hydro import hidrograma_projeto, cn_condicao_umidade
cn2 = 68.99                    # BHAE 2022, cn2.ana_med
cn3 = cn_condicao_umidade(cn2, "III")
hp = hidrograma_projeto(hiet_24h_2p5min, area_km2=3.1084, cn=cn2, tc_hours=0.4577)
print(hp.resumo()["qp_m3s"], hp.resumo()["chuva_efetiva_mm"])
7.5.7 Rainfall of the calibration event (January 11–12, 2011)
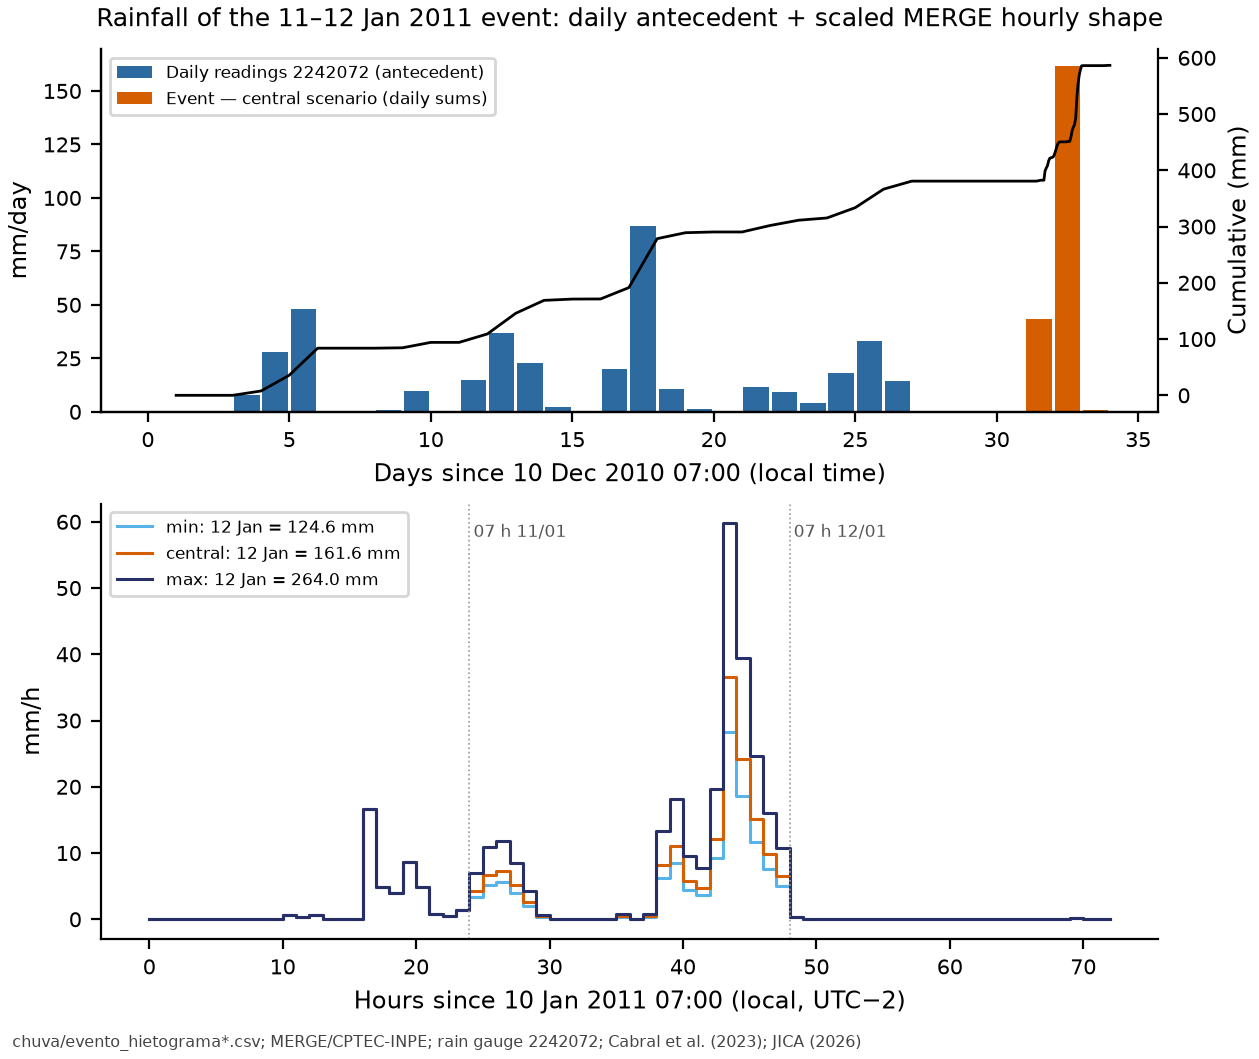
TRIGRS needs the event rainfall in hourly steps and the antecedent condition (decision D14). The reconstructed hyetograph (chuva/evento_hietograma.csv) starts on December 10, 2010 at 07:00 (local time; UTC−2 because of daylight saving time) and has 31 daily antecedent steps (readings of rain gauge 2242072) followed by 72 hourly steps (January 10, 07:00 to January 13, 07:00). The hourly shape comes from MERGE/CPTEC-INPE (0.1°; Rozante et al., 2010) in the cell of the point, which recorded 81.6 mm on the January 12 reading day and a peak of 18.5 mm/h in the hour ending at 03:00 local time on January 12 (05:00 UTC; the MERGE value was treated as the total of the hour ending at the indicated time, an assumption with an uncertainty of ±1 h). Each reading day (07:00–07:00) was scaled to a target total:
- January 11 and 13: rain gauge 2242072 itself (43.4 and 0.8 mm);
- January 12, three scenarios: minimum 124.6 mm (2242072), central 161.6 mm (Cabral et al., 2023, “Teresópolis — Vieira, Príncipe”) and maximum 264 mm (JICA, 2026, Part 1, Córrego do Príncipe).
| Scenario | Jan 12 (mm) | Scaling factor | 72-h total (mm) | Peak (mm/h) | Peak start (local time) | Max. 3 h (mm) | Max. 6 h (mm) |
|---|---|---|---|---|---|---|---|
| minimum | 124.6 | 1.53 | 168.8 | 28.2 | Jan 12, 2011 02:00 | 58.5 | 80.4 |
| central | 161.6 | 1.98 | 205.8 | 36.6 | Jan 12, 2011 02:00 | 75.8 | 104.3 |
| maximum | 264.0 | 3.24 | 308.2 | 59.8 | Jan 12, 2011 02:00 | 123.9 | 170.4 |
Antecedent condition. In the 30 days before the hourly window, 380.8 mm fell at 2242072 (90.4 mm in 10 days and 14.3 mm in 5 days — the four days before January 11 were dry). Subtracting the SCS runoff (30.2 mm) and the reference evapotranspiration from the Xavier dataset (106.1 mm), the mean net infiltration suggests rizero = 9.43 × 10⁻⁸ m/s for the initial background flux of TRIGRS (the gross rate, without losses, would be 1.47 × 10⁻⁷ m/s). The a priori range of report 04 is 1 × 10⁻⁹ to 5 × 10⁻⁸ m/s; since the suggestion exceeds the ceiling, the pipeline caps it there in the a priori run (Section 7.8.3).
7.6 Climate change
The method is that of the IDF-MC Portal (SEDEC/MIDR, release 2026.08.002), described in chapter 6 and in report 07: for each NEX-GDDP-CMIP6 model (0.25°; Thrasher et al., 2022), a Gumbel distribution is fitted by moments to the annual maximum daily rainfall in the model’s own historical window (1950–2014) and in the future window (2041–2070 or 2071–2100); the change factor (CF) is the ratio of the quantiles of the same TR, \(CF_m(T) = x_{T,\text{fut}}/x_{T,\text{hist}}\), and the ensemble is summarized by the P10, P50 and P90 percentiles across models. The future rainfall is \(Pd_{\text{fut}}(T) = CF(T)\,Pd_{\text{obs}}(T)\), and the future IDF/hyetographs are the present ones × CF.
Point D15 lies in cell 2700547 (centered at −22.375, −43.125), the same one used in step 07 (IDF-MC 3303906-2700547); the whole watershed is inside the cell, 1.37 km from its eastern edge. Factors are available for the four SSPs (Table 7.21, Figure 7.21).
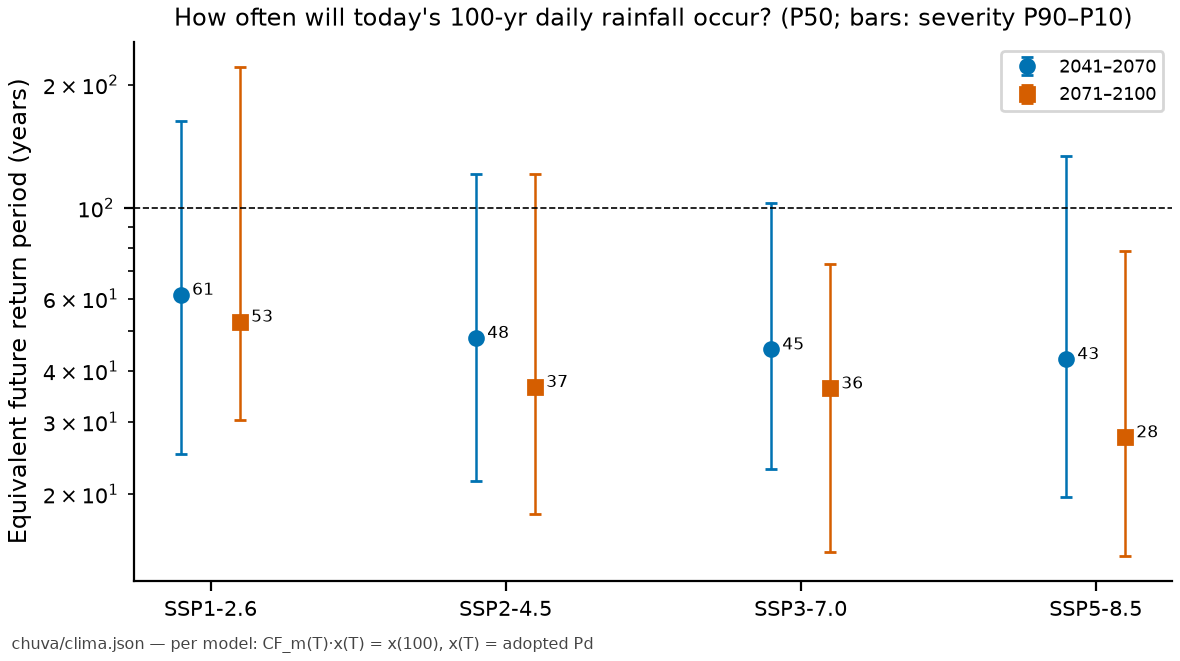
| Scenario | Horizon | Models | CF P10 | CF P50 | CF P90 | % CF > 1 | Pd100 P50 (mm) | Pd100 P10–P90 (mm) | Equivalent TR of today’s TR 100 rainfall (years) |
|---|---|---|---|---|---|---|---|---|---|
| SSP1-2.6 | 2041–2070 | 31 | 0.93 | 1.09 | 1.29 | 71 | 210 | 178–247 | 61 [25–163] |
| SSP1-2.6 | 2071–2100 | 31 | 0.88 | 1.12 | 1.26 | 81 | 214 | 169–242 | 53 [30–221] |
| SSP2-4.5 | 2041–2070 | 30 | 0.97 | 1.13 | 1.37 | 83 | 218 | 186–263 | 48 [22–121] |
| SSP2-4.5 | 2071–2100 | 30 | 0.97 | 1.20 | 1.40 | 83 | 229 | 186–268 | 37 [18–121] |
| SSP3-7.0 | 2041–2070 | 25 | 1.00 | 1.15 | 1.34 | 88 | 221 | 191–256 | 45 [23–103] |
| SSP3-7.0 | 2071–2100 | 25 | 1.05 | 1.20 | 1.46 | 100 | 230 | 202–280 | 36 [14–73] |
| SSP5-8.5 | 2041–2070 | 33 | 0.95 | 1.16 | 1.37 | 85 | 222 | 183–264 | 43 [20–134] |
| SSP5-8.5 | 2071–2100 | 33 | 1.04 | 1.25 | 1.49 | 94 | 239 | 200–286 | 28 [14–79] |
| TR | Present (mm) | SSP2-4.5 2041–2070 | SSP2-4.5 2071–2100 | SSP5-8.5 2041–2070 | SSP5-8.5 2071–2100 |
|---|---|---|---|---|---|
| 2 | 82 | 90 [82–98] | 95 [85–105] | 91 [84–101] | 99 [85–107] |
| 5 | 107 | 118 [105–135] | 127 [106–139] | 123 [107–135] | 131 [113–147] |
| 10 | 125 | 141 [122–162] | 149 [122–168] | 145 [124–163] | 154 [132–177] |
| 25 | 150 | 169 [145–198] | 179 [144–206] | 174 [146–202] | 188 [157–219] |
| 50 | 170 | 193 [165–230] | 203 [164–236] | 197 [164–231] | 213 [178–251] |
| 100 | 192 | 218 [186–263] | 229 [186–268] | 222 [183–264] | 239 [200–286] |
| 200 | 215 | 245 [209–296] | 257 [209–303] | 250 [204–299] | 267 [223–323] |
| 500 | 248 | 284 [241–344] | 297 [239–352] | 290 [235–351] | 308 [257–377] |
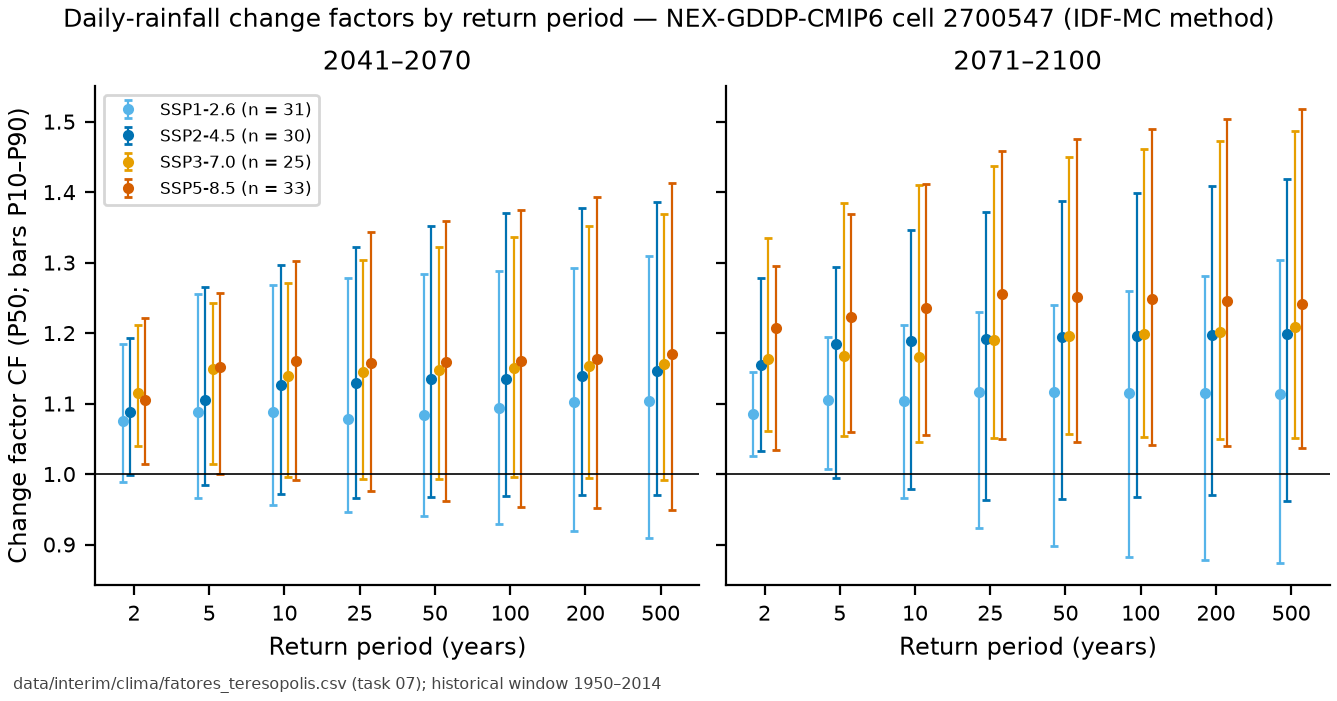
By the end of the century, under SSP5-8.5, the 100-year Pd rises from 192 to 239 mm (200–286 mm), and the daily rainfall that today occurs on average once every 100 years acquires a median TR of 28 years. The equivalent TR was computed model by model, solving \(CF_m(T)\,x(T) = x(100)\) with the adopted Pd as \(x(T)\), and summarized by the percentiles across models (severity P90 = 10th percentile of the TRs).
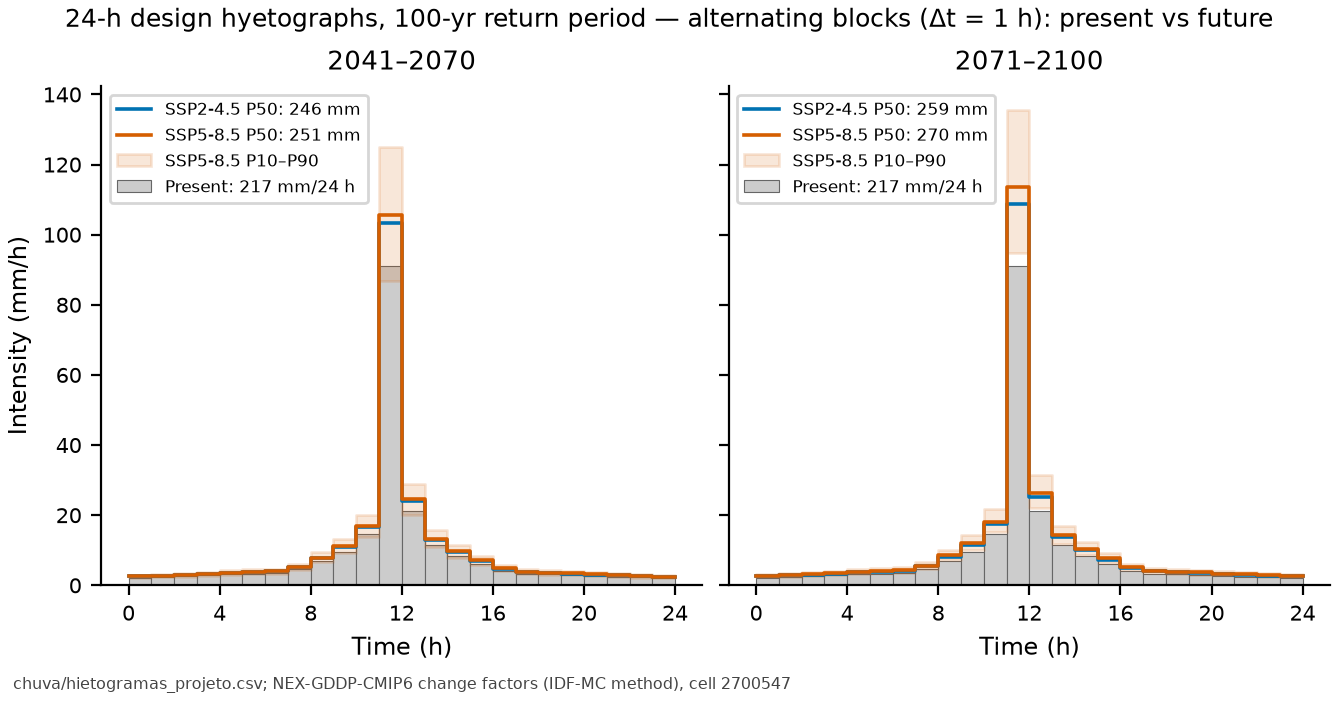
For discharge, the nonlinearity of SCS-CN amplifies the effect: at TR 100, Qp rises from 77.6 m³/s to 107.6 m³/s (SSP5-8.5, 2071–2100, P50; +39%) against +25% in rainfall. The limitations of the method (a cell of ~700 km², an imposed Gumbel distribution, extrapolation to TR ≥ 100, daily rainfall only) are discussed in report 07.
7.7 The traditional GIDES/JICA method
The manual’s volume accounting (§2.5) is reviewed in chapter 1 and applied with trigrs_mapper.sabo. The physical parameters come from Section 7.4; the erodible cross sections (Bd, De) would require a field survey and are documented assumptions with sensitivity analysis.
Concentration and Kf2. The mean slope over the 200 m upstream of the point is 5.62° (elevation drop along the longitudinal profile interpolated at exactly 200 m; the siting step, with the discrete D8 step, gave 5.7°, Table 7.3); following NILIM TN 904 (§2.6.3), θ = 10° is adopted, and the difference does not change Cd. Takahashi’s equilibrium concentration,
gives 0.288, below the lower limit: Cd = 0.30 (as in the official design). The runoff correction factor is \(K_{f2} = 0.05(\log_{10} A - 2)^2 + 0.05\) = 0.1636 for A = 3.1084 km² (JICA: 0.16 for 3.19 km²).
Vdy11 and Vdy12 (method b). A mean erodible cross section was adopted for each order class (Table 7.23): for orders 1–2 and the zero-order thalwegs, Bd = 2.3 m (width measured in the first-order erosion reach of Appendix A) and De = 1.0 m (shallow failures of 0.5–2.0 m in the region; Marques et al., 2017); for orders 3–5, Bd = 10 m (width adopted at the valley outlet in Appendix A; the DEM gives a median W1 of 27 m along the trunk channel, an upper bound) and De = 2.0 m (thick colluvium; scour of ≈ 3.5 m in 2011, Conq et al., 2015; in Japan De > 5 m is rare, according to the manual).
| Reach | L (m) | Bd (m) | De (m) | Ady = Bd·De (m²) | V (m³) |
|---|---|---|---|---|---|
| order 1 | 13,258 | 2.3 | 1.0 | 2.3 | 30,493 |
| order 2 | 5,561 | 2.3 | 1.0 | 2.3 | 12,791 |
| order 3 | 2,497 | 10.0 | 2.0 | 20.0 | 49,938 |
| order 4 | 1,803 | 10.0 | 2.0 | 20.0 | 36,068 |
| order 5 | 314 | 10.0 | 2.0 | 20.0 | 6,276 |
| order 0 | 35,681 | 2.3 | 1.0 | 2.3 | 82,067 |
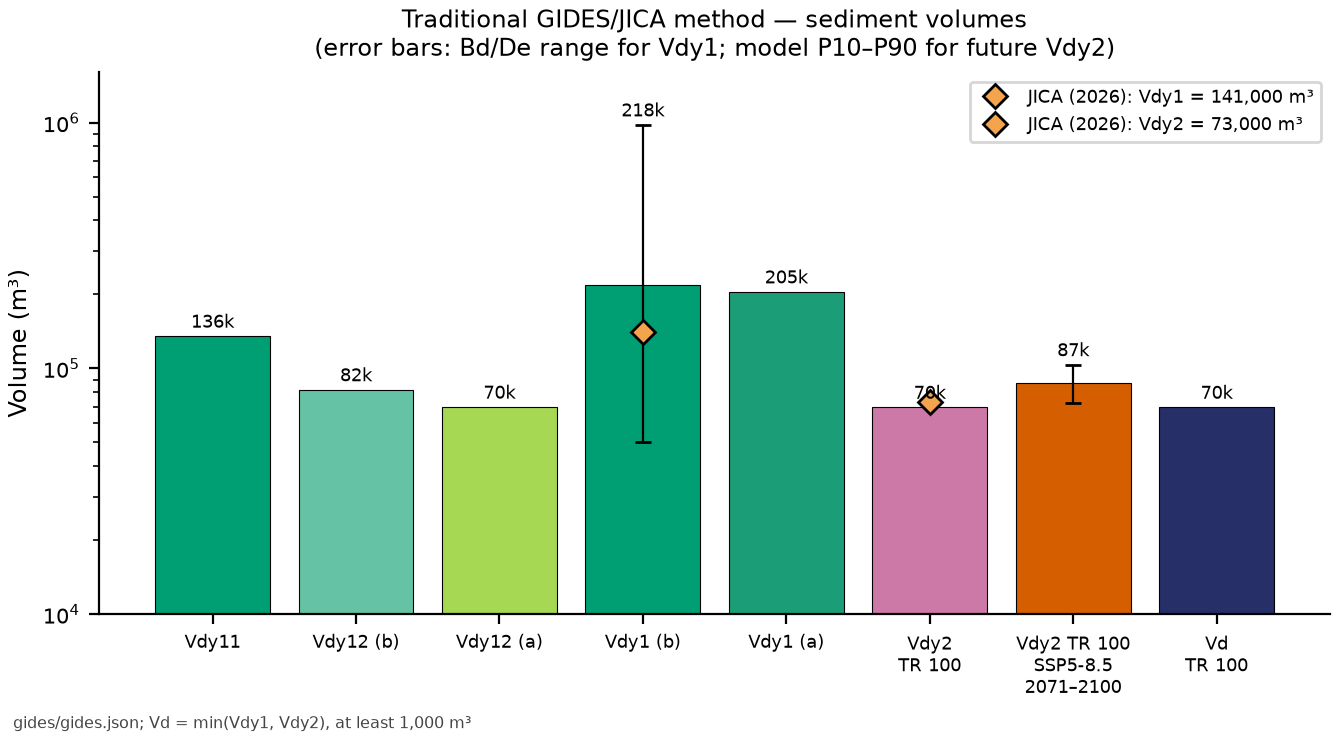
Result: Vdy11 = 135,567 m³, Vdy12 (b) = 82,067 m³ and Vdy1 = 217,633 m³, with a range of 50,321–981,037 m³ between the extreme combinations of Bd and De. The one-factor-at-a-time sensitivity analysis in Table 7.24 shows that the channel threshold and the cross sections of the two largest-volume classes dominate: orders 3–5 (42% of Vdy1) and the zero-order thalwegs (38%). Within a class, Bd and De have the same relative effect, because they enter as a product (Ady = Bd·De); the different spans in the table come only from the ranges tested. JICA obtained 141,000 m³ (140,112 m³ in orders 0–3) with a field survey and a sparser network (maximum order 3).
| Parameter | Value | Vdy11 (m³) | Vdy12 b (m³) | Vdy1 b (m³) |
|---|---|---|---|---|
| Bd orders 1–2 (m) | 1.00 | 111,101 | 82,067 | 193,168 |
| Bd orders 1–2 (m) | 2.30 | 135,567 | 82,067 | 217,633 |
| Bd orders 1–2 (m) | 5.00 | 186,379 | 82,067 | 268,446 |
| De orders 1–2 (m) | 0.50 | 113,924 | 82,067 | 195,991 |
| De orders 1–2 (m) | 1.00 | 135,567 | 82,067 | 217,633 |
| De orders 1–2 (m) | 2.00 | 178,851 | 82,067 | 260,918 |
| Bd orders 3–5 (m) | 5.00 | 89,426 | 82,067 | 171,492 |
| Bd orders 3–5 (m) | 10.00 | 135,567 | 82,067 | 217,633 |
| Bd orders 3–5 (m) | 27.00 | 292,446 | 82,067 | 374,513 |
| De orders 3–5 (m) | 1.00 | 89,426 | 82,067 | 171,492 |
| De orders 3–5 (m) | 2.00 | 135,567 | 82,067 | 217,633 |
| De orders 3–5 (m) | 3.50 | 204,778 | 82,067 | 286,845 |
| Bd zero order (m) | 1.00 | 135,567 | 35,681 | 171,248 |
| Bd zero order (m) | 2.30 | 135,567 | 82,067 | 217,633 |
| Bd zero order (m) | 5.00 | 135,567 | 178,406 | 313,972 |
| De zero order (m) | 0.50 | 135,567 | 41,033 | 176,600 |
| De zero order (m) | 1.00 | 135,567 | 82,067 | 217,633 |
| De zero order (m) | 2.00 | 135,567 | 164,133 | 299,700 |
| channel threshold (ha) | 0.25 | 314,429 | 189,086 | 503,514 |
| channel threshold (ha) | 0.50 | 203,099 | 112,603 | 315,702 |
| channel threshold (ha) | 1.00 | 135,567 | 82,067 | 217,633 |
| channel threshold (ha) | 2.00 | 87,300 | 75,419 | 162,719 |
| channel threshold (ha) | 3.00 | 64,423 | 78,049 | 142,472 |
| channel threshold (ha) | 5.00 | 56,351 | 73,381 | 129,732 |
Vdy12 by method a (2011 scars). The manual allows the hillslope volume to be estimated from failure maps; here the “map” is the inventory of the event itself: the approximate failure zones (upper third by elevation, and area 1.5 W² of Marc et al., 2018; step 02) of the 51 scars that touch the watershed, multiplied by thicknesses of 1 to 2 m (Table 7.25). In the central scenario (upper third, shifted inventory, 1.5 m), Vdy12 (a) = 69,719 m³ in situ, and Vdy1 (a) = 205,286 m³. This is the order of magnitude of what the 2011 event actually mobilized on the hillslopes — and it is the term that TRIGRS will refine (Section 7.10). The last column of Table 7.25 (116,199 m³ in the central scenario) follows the “bulked” convention of chapter 5 (D7), which treats the in situ column as if it were all grains; since D18 it is only an upper bound, and the comparison with TRIGRS is made in situ or in the deposited form (Section 7.10.1).
| Failure zone | Inventory | Polygons | Area (m²) | Thickness (m) | Vdy12 a in situ (m³) | bulked /(1 − 0.4) (m³) |
|---|---|---|---|---|---|---|
| upper third (elevation) | shifted (D17) | 51 | 46,480 | 1.0 | 46,480 | 77,466 |
| upper third (elevation) | shifted (D17) | 51 | 46,480 | 1.5 | 69,719 | 116,199 |
| upper third (elevation) | shifted (D17) | 51 | 46,480 | 2.0 | 92,959 | 154,932 |
| upper third (elevation) | original | 54 | 47,301 | 1.0 | 47,301 | 78,835 |
| upper third (elevation) | original | 54 | 47,301 | 1.5 | 70,951 | 118,252 |
| upper third (elevation) | original | 54 | 47,301 | 2.0 | 94,602 | 157,670 |
| 1.5·W² (Marc et al., 2018) | shifted (D17) | 51 | 33,470 | 1.0 | 33,470 | 55,783 |
| 1.5·W² (Marc et al., 2018) | shifted (D17) | 51 | 33,470 | 1.5 | 50,205 | 83,674 |
| 1.5·W² (Marc et al., 2018) | shifted (D17) | 51 | 33,470 | 2.0 | 66,939 | 111,566 |
| 1.5·W² (Marc et al., 2018) | original | 53 | 37,206 | 1.0 | 37,206 | 62,009 |
| 1.5·W² (Marc et al., 2018) | original | 53 | 37,206 | 1.5 | 55,808 | 93,014 |
| 1.5·W² (Marc et al., 2018) | original | 53 | 37,206 | 2.0 | 74,411 | 124,019 |
| whole polygon | shifted (D17) | 51 | 143,326 | 1.0 | 143,326 | 238,876 |
| whole polygon | shifted (D17) | 51 | 143,326 | 1.5 | 214,988 | 358,314 |
| whole polygon | shifted (D17) | 51 | 143,326 | 2.0 | 286,651 | 477,752 |
| whole polygon | original | 54 | 159,643 | 1.0 | 159,643 | 266,072 |
| whole polygon | original | 54 | 159,643 | 1.5 | 239,465 | 399,109 |
| whole polygon | original | 54 | 159,643 | 2.0 | 319,287 | 532,145 |
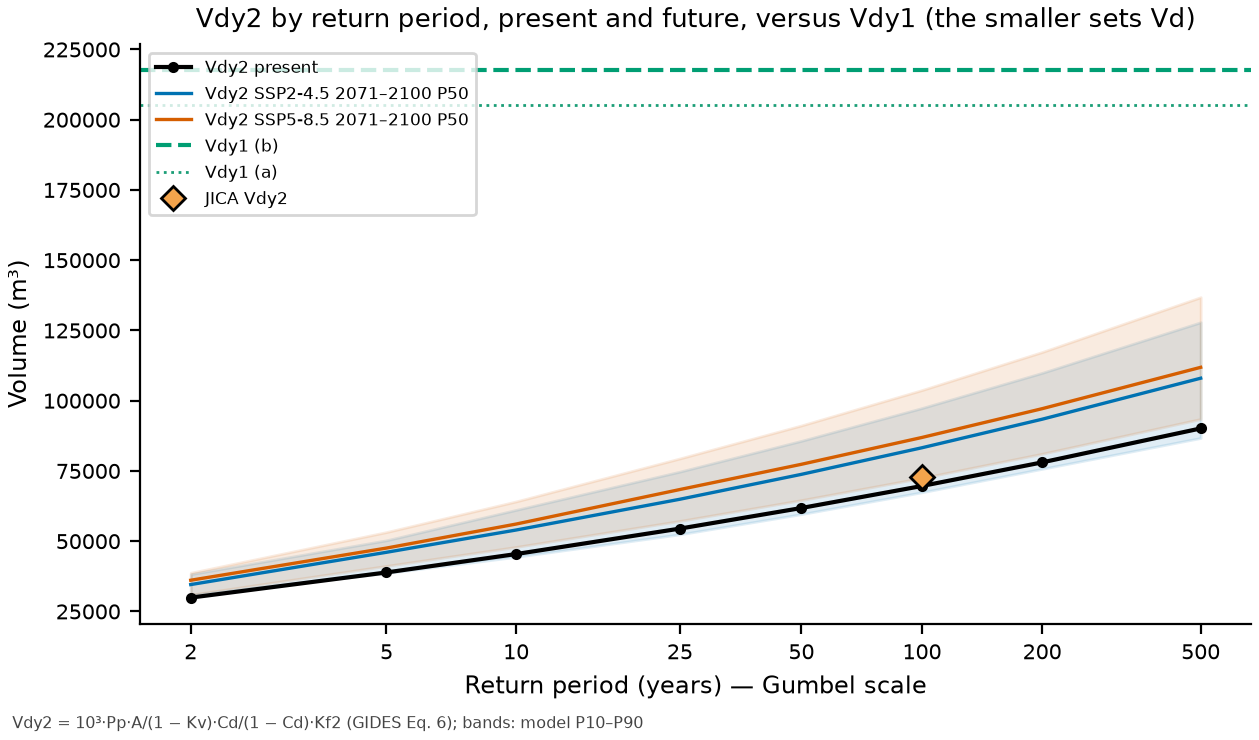
Vdy2, Vd and peak discharge. The volume transportable by the design rainfall is
which is linear in \(P_p\) (Table 7.26). The design sediment volume is \(V_d = \min(V_{dy1}, V_{dy2})\), with a minimum of 1,000 m³. The debris-flow peak discharge was computed by the two paths of Annex 1: the empirical one, \(Q_{sp} = c \, \Sigma Q\), \(\Sigma Q = C^* V_{dqp}/C_d\), with \(c\) = 0.002 (GIDES) and 0.01 (NILIM TN 904, five times larger; discrepancy documented in report 04 and in the code), and the rational one, \(Q_{sp} = K_q Q_p\) with \(K_q = C^*/(C^* - C_d)\) = 2.00 and \(Q_p\) from the SCS hydrograph.
| TR (years) | Pp (mm) | Vdy2 (m³) | Vdy1 b (m³) | Governs | Vd (m³) | Vd + Vw (m³) | Qsp 0.002 (m³/s) | Qsp 0.01 (m³/s) | Qp (m³/s) | Kq·Qp (m³/s) |
|---|---|---|---|---|---|---|---|---|---|---|
| 2 | 82.4 | 29,920 | 217,633 | Vdy2 | 29,920 | 30,264 | 120 | 598 | 15.5 | 31 |
| 5 | 107.0 | 38,875 | 217,633 | Vdy2 | 38,875 | 39,219 | 156 | 778 | 27.8 | 56 |
| 10 | 125.0 | 45,426 | 217,633 | Vdy2 | 45,426 | 45,769 | 182 | 909 | 37.6 | 75 |
| 25 | 150.0 | 54,482 | 217,633 | Vdy2 | 54,482 | 54,826 | 218 | 1,090 | 52.0 | 104 |
| 50 | 170.1 | 61,810 | 217,633 | Vdy2 | 61,810 | 62,154 | 247 | 1,236 | 64.2 | 128 |
| 100 | 191.7 | 69,646 | 217,633 | Vdy2 | 69,646 | 69,990 | 279 | 1,393 | 77.6 | 155 |
| 200 | 214.8 | 78,049 | 217,633 | Vdy2 | 78,049 | 78,393 | 312 | 1,561 | 92.1 | 184 |
| 500 | 248.1 | 90,128 | 217,633 | Vdy2 | 90,128 | 90,472 | 361 | 1,803 | 113.3 | 227 |
For all TRs up to 500 years the volume is transport-limited (\(V_{dy2} < V_{dy1}\)), as in the official design (Vdy2 = 73,000 m³ < Vdy1 = 141,000 m³): at the design TR (100 years), Vd = 69,646 m³ (JICA: 73,000 m³; −5%), and the difference comes from Pp (191.7 vs. 199 mm; −3.7%), from A (3.108 vs. 3.19 km²; −2.6%) and from Kf2 (0.1636 vs. 0.16; +2.3%), with the same Cd = 0.30. Therefore, unlike Nova Friburgo (supply-limited), here the design rainfall controls the volume — and climate change increases it directly. The empirical Qsp with c = 0.002 is 279 m³/s at TR 100 (JICA: 200 m³/s with Vdqp = 50,000 m³; the same formula with JICA’s values reproduces exactly 200 m³/s); with c = 0.01 it would be 1,393 m³/s, and by the rational path, 155 m³/s.
Woody debris. Without a forest survey, the parameters of Appendix A (8 trees/100 m², DBH = 0.25 m, Hw = 6 m, Kd = 0.6) were used, weighted by the GLAD 2010 tree-cover fraction in the watershed (98.3%), with Bd = 10 m and Ldy13 = 2,748 m (main thalweg): Vwy = 382 m³ and Vw = 0.9·Vwy = 344 m³ (with Ldy13 equal to the network of orders ≥ 3, Vwy = 641 m³). JICA disregarded woody debris in Teresópolis.
Climate scenarios. Since Vdy2 is linear in Pp, \(V_{dy2,\text{fut}} = CF \cdot V_{dy2}\) (Table 7.27, Figure 7.25). At TR 100, under SSP5-8.5 at the end of the century, Vdy2 rises to 86,917 m³ (P10–P90: 72,523–103,783 m³) and remains below Vdy1 (b), so that Vd grows in the same proportion as the rainfall.
| Scenario | Horizon | Pp100 P50 (mm) | Vdy2 P50 (m³) | Vdy2 P10–P90 (m³) | Vd P50 (m³) | Governs (P50) | Qsp 0.002 P50 (m³/s) | Kq·Qp P50 (m³/s) |
|---|---|---|---|---|---|---|---|---|
| SSP1-2.6 | 2041–2070 | 210 | 76,186 | 64,705–89,707 | 76,186 | Vdy2 | 305 | 178 |
| SSP1-2.6 | 2071–2100 | 214 | 77,687 | 61,439–87,741 | 77,687 | Vdy2 | 311 | 183 |
| SSP2-4.5 | 2041–2070 | 218 | 79,022 | 67,520–95,436 | 79,022 | Vdy2 | 316 | 188 |
| SSP2-4.5 | 2071–2100 | 229 | 83,255 | 67,414–97,389 | 83,255 | Vdy2 | 333 | 202 |
| SSP3-7.0 | 2041–2070 | 221 | 80,156 | 69,329–93,119 | 80,156 | Vdy2 | 321 | 192 |
| SSP3-7.0 | 2071–2100 | 230 | 83,524 | 73,323–101,740 | 83,524 | Vdy2 | 334 | 203 |
| SSP5-8.5 | 2041–2070 | 222 | 80,827 | 66,399–95,751 | 80,827 | Vdy2 | 323 | 194 |
| SSP5-8.5 | 2071–2100 | 239 | 86,917 | 72,523–103,783 | 86,917 | Vdy2 | 348 | 215 |
| Item | JICA (2026) | This study | Difference (%) |
|---|---|---|---|
| A (km²) | 3.190 | 3.108 | −3 |
| Bed slope θ upstream of the point (°) | 4.400 | 5.624 | +28 |
| Cd | 0.300 | 0.300 | 0 |
| Kf2 | 0.160 | 0.164 | +2 |
| Pp TR 100 (mm) | 199 | 192 | −4 |
| Vdy1 (m³) | 141,000 | 217,633 | +54 |
| Vdy2 TR 100 (m³) | 73,000 | 69,646 | −5 |
| Design sediment volume (m³) | 73,000 | 69,646 | −5 |
| Qsp (m³/s), coef. 0.002 | 200 | 279 | +39 |
| Water discharge Q (m³/s) | 59 | 78 | +31 |
scripts/casos/teresopolis/06_gides.py (excerpt)
from trigrs_mapper.sabo import cd_takahashi, kf2, vdy2_m3, volume_projeto, soma_q_m3, qsp_envelope, kq
A = 3.1084                                # km² (ANADEM 10 m, point D15)
cd = cd_takahashi(max(5.62, 10.0)).cd             # minimum θ of 10° (NILIM) -> 0.30
v2 = vdy2_m3(pp_mm=191.7, area_km2=A, cd=cd, kf2_valor=kf2(A))   # TR 100
vp = volume_projeto(vdy1=217633, vdy2=v2, vw=344)
print(vp["volume_sedimentos_m3"], qsp_envelope(soma_q_m3(vp["volume_sedimentos_m3"], cd)), kq(cd))All products, figures and the original (Portuguese) text of these sections are generated by scripts/casos/teresopolis/rodar_tudo.sh (the project’s Python 3.12; trigrs_mapper.hydro and trigrs_mapper.sabo; the CN comes from the DPM database in a read-only session). Files: chuva/{estacoes, maximas_anuais, pd_tr, hietogramas_projeto, hidrogramas_projeto, evento_hietograma}.csv, chuva/{ajustes, idf, clima, cn, hidrograma_resumo, evento_meta, antecedente}.json, gides/gides.json and gides/tabelas/*.csv; technical summary in docs/resultados/teresopolis_hidro_gides.md.
7.8 TRIGRS modeling
This section builds, cell by cell, the physical model that the following sections calibrate (Section 7.9) and convert into volume (Section 7.10). TRIGRS 2.1 (Baum et al., 2008; Alvioli & Baum, 2016) combines transient rainfall infiltration with the infinite-slope model: in each cell and at each time, it computes the profile of the factor of safety FS(Z, t) down to the base of the soil and stores the minimum FS and the depth at which it occurs, Zcr. The theory is in chapter 1 and the complete workflow, with the same steps, in chapter 6; here it is applied to Teresópolis with all the numbers of the case.
The model runs on two domains. The watershed of point D15 (3.108 km², 31,084 cells of 10 m) is where the volumes are computed; the calibration window TER_calibracao (5.55 × 5.55 km at 30 m; 34,225 valid cells, 30.8 km²; report 02) surrounds the watershed and the neighboring 2011 scars. All grids are in SIRGAS 2000 / UTM zone 23S and have NODATA in the same positions (TRIGRS only checks the cell count); the 10 m grid is ANADEM resampled by bicubic interpolation, which creates no new information (D5).
7.8.1 Geotechnical units and property zones
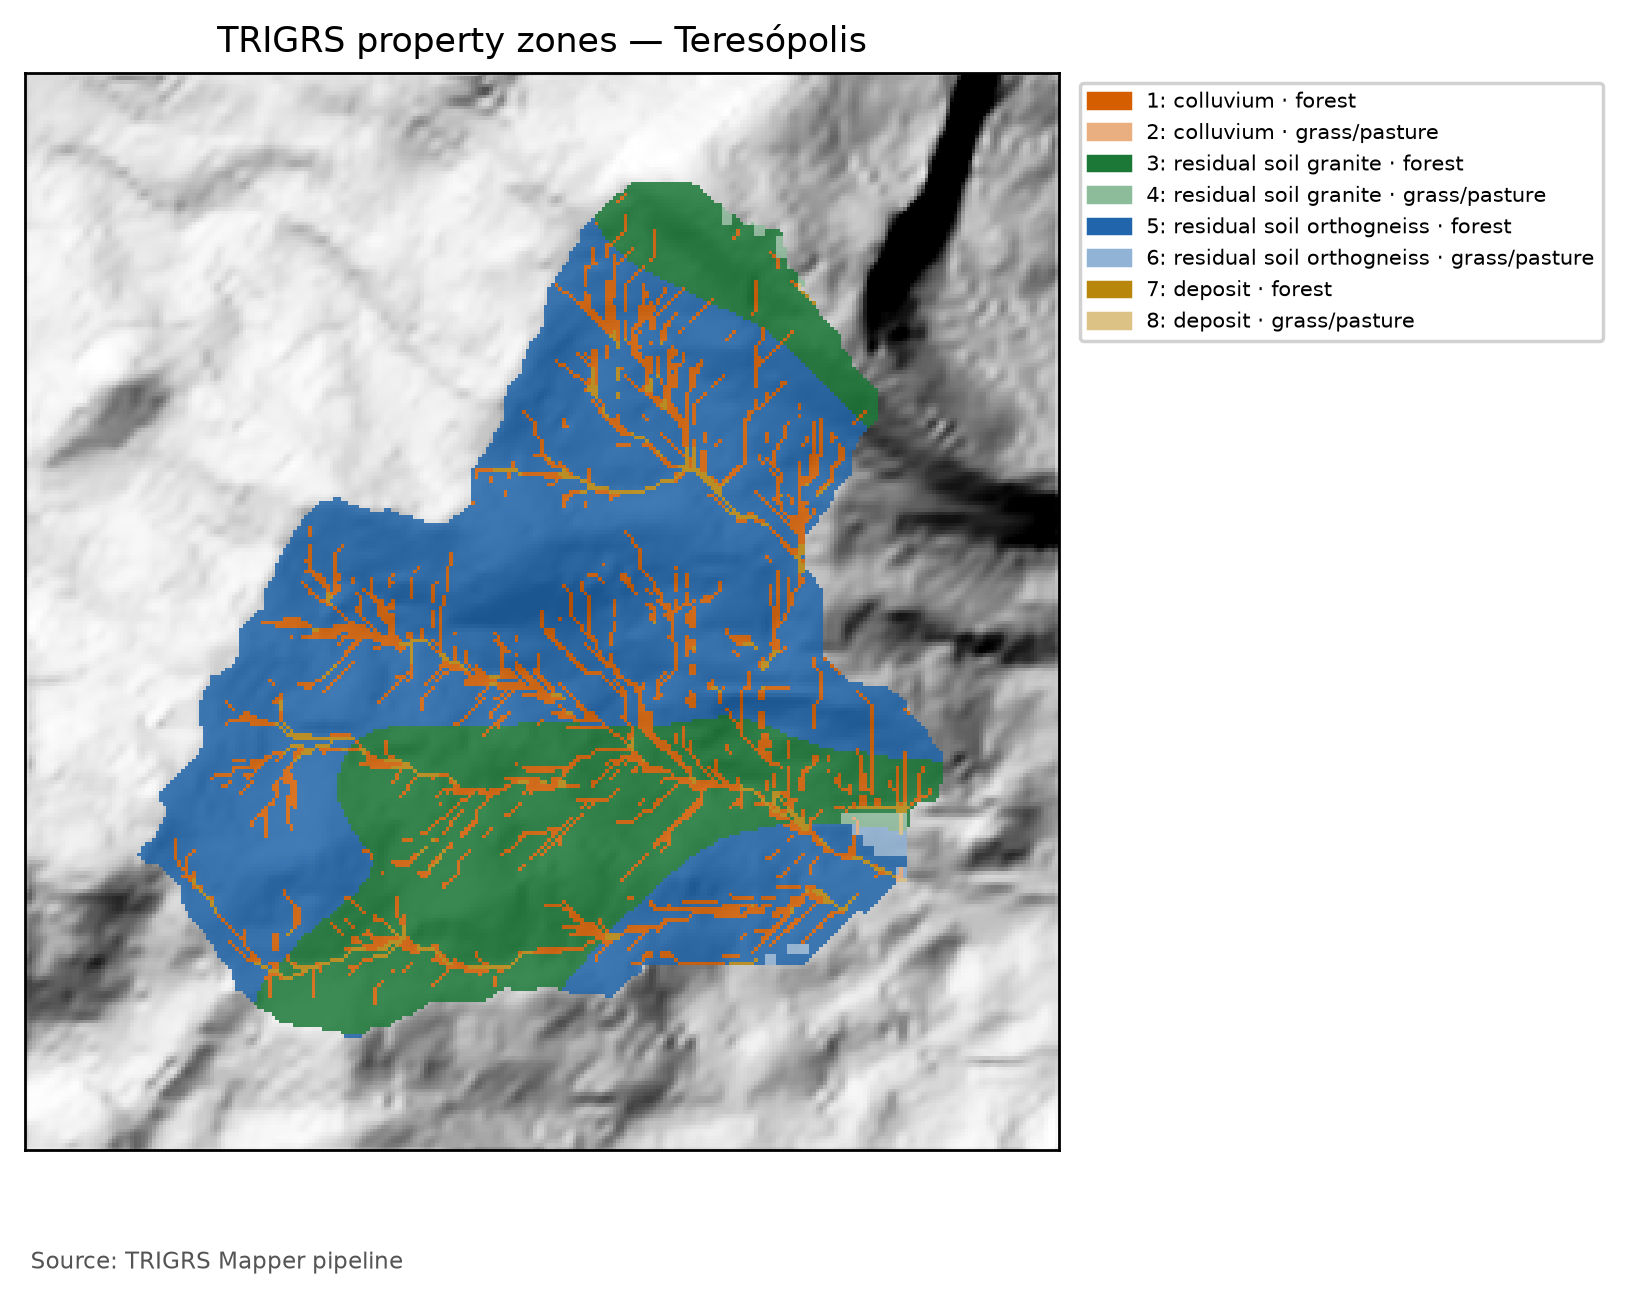
TRIGRS accepts one set of properties per zone (the zone, n lines of tr_in.txt). The zones result from crossing three maps: the geotechnical unit, the lithology and the land-cover group, which sets the root cohesion. Each cell receives the first unit of Table 7.29 that applies to it (trigrs_mapper.params; report 04).
| Priority | Unit | Rule | Basis |
|---|---|---|---|
| 1 | rock outcrop | MapBiomas class 29 in 2015 and in 2025 (persistent outcrop, so that a recent scar is not taken for rock) | MapBiomas |
| 2 | talus/alluvial deposit | Quaternary units (Q*) of the geology or valley floor: A ≥ 1 ha and β < 10° (GIDES deposition band) |
SGB 1:100,000; ANADEM |
| 3 | colluvium | hollows and thalwegs: plan curvature < 0 and A ≥ 0.25 ha (minimum area of the zero-order thalwegs, Section 7.4) | ANADEM 10 m |
| 4 | shallow soil on rock | immediate neighborhood (8 cells) of the outcrop, or soil map unit whose dominant component is AR (rock outcrop) |
MapBiomas; IBGE 1:250,000 |
| 5 | mature residual soil | remaining hillslopes, split into granite × orthogneiss (Teresópolis Granite × Rio Negro Complex), with the same a priori values | SGB 1:100,000 |
The land cover sets the root cohesion Cr, an effective cohesion on the failure plane (report 04 §5): in group G1 (forest), the central value of 2 kPa comes from the only shear test with roots in the region (José, 2016, in Nova Friburgo); G3 (herbaceous, pasture and mosaic) receives 0.5 kPa (estimate); G0 (built-up area, water) has no roots. The runs of the 2011 event (calibration, event and sensitivity) use the pre-event GLAD 2010 cover (Figure 7.7); the design runs and the thresholds use the current condition, MapBiomas 2025 (Figure 7.9). The watershed therefore has two parameterizations, with independently numbered zones: the design one (Table 7.30 and Figure 7.26), which is that of the annotated tr_in.txt in Section 7.8.5, and the event one (Table 7.31), with the same land cover as the calibration window. “Zone 1” of one is not “zone 1” of the other.
In each zone, the central a priori values of the parameter table (report 04 §11) are adjusted by the calibration multipliers, which change the magnitude of each property without undoing the spatial pattern of the maps:
The unit weight is derived from the saturated water content and the grain density, \(\gamma_s = \gamma_w\,[G_s(1-\theta_s) + \theta_s]\), because in unsaturated mode TRIGRS recomputes \(G_s\) from \(\gamma_s\) and \(\theta_s\), and independently sampled values would produce physically impossible grains (report 04 §1.3). The outcrop is a conventional zone (c = 100 kPa, Ks = 1 × 10⁻⁹ m/s, α < 0) that receives no multipliers.
tr_in.txt) with the calibrated multipliers (full calibration, sample lhs_0019: mc = 0.92, mtanφ = 1.04, mKs = 0.70, rD0 = 39 m, mα = 0.57, mCr = 1.42). c′ = c′0·mc and cr = Cr·mCr (total cohesion c = c′ + cr); tan φ′ = mtanφ·tan φ′0; Ks = Ks0·mKs; D0 = rD0·Ks; α = α0·mα; γs derived from θs and Gs. The rock outcrop is the conventional, uncalibrated zone (α < 0: saturated infiltration). The event run uses the event land cover and a different numbering (event zone table).
| Zone · unit (lithology) · land cover | c′ + cr (kPa) | φ′ (°) | γs (kN/m³) | Ks (m/s) | D0 (m²/s) | θs / θr | α (1/m) | Area (%) |
|---|---|---|---|---|---|---|---|---|
| 1 · colluvium · G1 | 2.77 + 2.84 | 34.9 | 18.02 | 7.02 × 10⁻⁶ | 2.74 × 10⁻⁴ | 0.48 / 0.08 | 2.85 | 11.8 |
| 2 · colluvium · G3 | 2.77 + 0.71 | 34.9 | 18.02 | 7.02 × 10⁻⁶ | 2.74 × 10⁻⁴ | 0.48 / 0.08 | 2.85 | < 0.1 |
| 3 · mature residual soil (granite) · G1 | 4.61 + 2.84 | 36.0 | 17.81 | 7.02 × 10⁻⁶ | 2.74 × 10⁻⁴ | 0.50 / 0.10 | 3.99 | 28.7 |
| 4 · mature residual soil (granite) · G3 | 4.61 + 0.71 | 36.0 | 17.81 | 7.02 × 10⁻⁶ | 2.74 × 10⁻⁴ | 0.50 / 0.10 | 3.99 | 0.3 |
| 5 · mature residual soil (orthogneiss) · G1 | 4.61 + 2.84 | 36.0 | 17.81 | 7.02 × 10⁻⁶ | 2.74 × 10⁻⁴ | 0.50 / 0.10 | 3.99 | 57.0 |
| 6 · mature residual soil (orthogneiss) · G3 | 4.61 + 0.71 | 36.0 | 17.81 | 7.02 × 10⁻⁶ | 2.74 × 10⁻⁴ | 0.50 / 0.10 | 3.99 | 0.4 |
| 7 · talus/alluvium deposit · G1 | 0.92 + 2.84 | 37.0 | 19.60 | 3.51 × 10⁻⁵ | 1.37 × 10⁻³ | 0.38 / 0.05 | 4.56 | 1.8 |
| 8 · talus/alluvium deposit · G3 | 0.92 + 0.71 | 37.0 | 19.60 | 3.51 × 10⁻⁵ | 1.37 × 10⁻³ | 0.38 / 0.05 | 4.56 | < 0.1 |
tr_in.txt) with the multipliers in use (full calibration, sample lhs_0019: mc = 0.92, mtanφ = 1.04, mKs = 0.70, rD0 = 39 m, mα = 0.57, mCr = 1.42). c′ = c′0·mc and cr = Cr·mCr (total cohesion c = c′ + cr); tan φ′ = mtanφ·tan φ′0; Ks = Ks0·mKs; D0 = rD0·Ks; α = α0·mα; γs derived from θs and Gs. The rock outcrop is the conventional, uncalibrated zone (α < 0: saturated infiltration). The calibration window (30 m) uses the same event land cover.
| Zone · unit (lithology) · land cover | c′ + cr (kPa) | φ′ (°) | γs (kN/m³) | Ks (m/s) | D0 (m²/s) | θs / θr | α (1/m) | Area (%) |
|---|---|---|---|---|---|---|---|---|
| 1 · colluvium · G0 | 2.77 + 0.00 | 34.9 | 18.02 | 7.02 × 10⁻⁶ | 2.74 × 10⁻⁴ | 0.48 / 0.08 | 2.85 | 0.3 |
| 2 · colluvium · G1 | 2.77 + 2.84 | 34.9 | 18.02 | 7.02 × 10⁻⁶ | 2.74 × 10⁻⁴ | 0.48 / 0.08 | 2.85 | 11.5 |
| 3 · mature residual soil (granite) · G0 | 4.61 + 0.00 | 36.0 | 17.81 | 7.02 × 10⁻⁶ | 2.74 × 10⁻⁴ | 0.50 / 0.10 | 3.99 | 0.9 |
| 4 · mature residual soil (granite) · G1 | 4.61 + 2.84 | 36.0 | 17.81 | 7.02 × 10⁻⁶ | 2.74 × 10⁻⁴ | 0.50 / 0.10 | 3.99 | 28.1 |
| 5 · mature residual soil (orthogneiss) · G0 | 4.61 + 0.00 | 36.0 | 17.81 | 7.02 × 10⁻⁶ | 2.74 × 10⁻⁴ | 0.50 / 0.10 | 3.99 | 0.4 |
| 6 · mature residual soil (orthogneiss) · G1 | 4.61 + 2.84 | 36.0 | 17.81 | 7.02 × 10⁻⁶ | 2.74 × 10⁻⁴ | 0.50 / 0.10 | 3.99 | 56.9 |
| 7 · mature residual soil (orthogneiss) · G3 | 4.61 + 0.71 | 36.0 | 17.81 | 7.02 × 10⁻⁶ | 2.74 × 10⁻⁴ | 0.50 / 0.10 | 3.99 | 0.1 |
| 8 · talus/alluvium deposit · G0 | 0.92 + 0.00 | 37.0 | 19.60 | 3.51 × 10⁻⁵ | 1.37 × 10⁻³ | 0.38 / 0.05 | 4.56 | < 0.1 |
| 9 · talus/alluvium deposit · G1 | 0.92 + 2.84 | 37.0 | 19.60 | 3.51 × 10⁻⁵ | 1.37 × 10⁻³ | 0.38 / 0.05 | 4.56 | 1.8 |
Esteves et al. (2024) tested residual soils of granite, granitoid and gneiss in this watershed: under submerged conditions, c′ of 4 to 23 kPa and φ′ of 39° to 41°; laboratory Ks between 6.8 × 10⁻⁶ and 1.7 × 10⁻⁵ m/s; in the back-analysis with SHALSTAB, the Ks that reproduced the scars was 2 to 7 times the laboratory value (2 × 10⁻⁵ to 7 × 10⁻⁵ m/s; report 04 §4). The a priori c′ and Ks of the mature residual soil (5 kPa and 1 × 10⁻⁵ m/s) lie within these ranges, and the a priori φ′ (35°) is a few degrees lower; all of them come from few points. Compare the calibrated Ks and c′ in Table 7.30 with these tests: multipliers far from 1 indicate that the calibration is compensating for something else (the event rainfall, the soil thickness or the initial water table).
In the full calibration, the strength and permeability multipliers stayed close to 1: mc = 0.92, mtanφ = 1.04 and mKs = 0.70 (Table 7.35). In the mature residual soil — the unit tested by Esteves et al. (2024) and the one that covers most of the watershed — the calibrated effective cohesion lies at the lower end of the tested range, φ′ remains a few degrees below it, on the conservative side, and Ks is close to the lowest laboratory value, below those of the SHALSTAB back-analysis (Table 7.30). The calibration therefore barely changed strength and permeability, which were already consistent with the tests. The largest adjustments are in the parameters not measured in the watershed — soil thickness, root cohesion, α, diffusivity and the initial condition (Section 7.9.4) — and that is where the calibration absorbs what is not known about the event rainfall, the thickness and the water table.
7.8.2 Soil thickness and the bedrock caps
In TRIGRS, zmax is the low-permeability base: the boundary on which water pressure builds up and the limit of the failure surfaces tested. In the Rio de Janeiro Highlands it corresponds to the contact of the colluvium or of the mature soil with the saprolite, or of the soil with the rock, at about 1 to 2.5 m (report 04 §6.1) — and not to the SoilGrids depth to bedrock (BDTICM), which measures the whole regolith, always exceeds the 5 m cap adopted below and therefore does not constrain the model (Section 7.3). Without thickness measurements in the watershed, the exponential model of slope β (in degrees) is adopted:
with \(m_z\) = 1 and \(k_z\) = 0.0347 per degree a priori: the curve passes through 2.0 m at 30° and 1.0 m at 50° and stays within 0.35 m of that of DeRose (1996)/Salciarini et al. (2006) above 30°. The bedrock enters through the caps of each unit: 0.1 m on the outcrop, 0.5 m in its neighborhood (Neossolo Litólico, a Leptosol) and 1.0 m in the soil map units in which rock outcrop (AR) is the dominant component. The calibration adjusts \(m_z\) and \(k_z\) (calibrated values: 0.62 and 0.0269 per degree, Table 7.35); the resulting map is in Figure 7.27. Because a thickness derived from slope alone was the worst of the options compared by Segoni et al. (2012), the sensitivity analysis also tests the DeRose curve, uniform thicknesses, a linear decrease with slope and the rescaled spatial pattern of BDTICM (regolito), always with the same caps (Section 7.9.7).
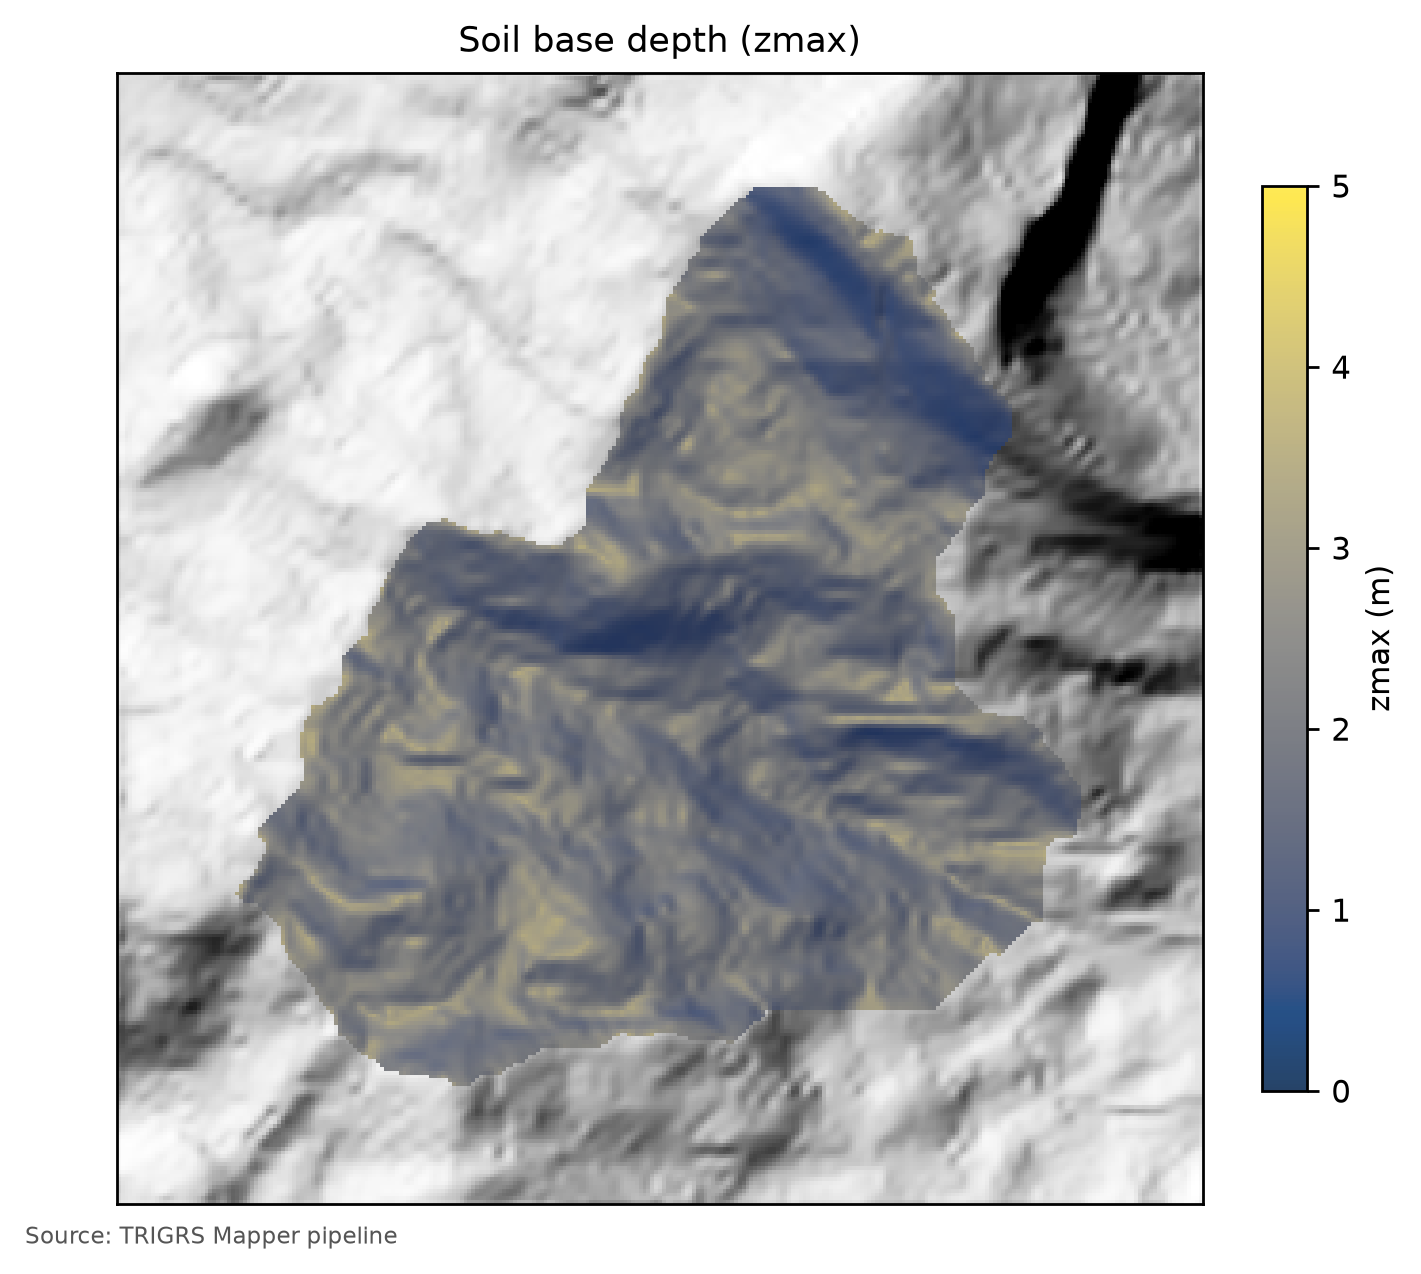
zmax in the watershed (10 m), with the calibrated multipliers: greater thicknesses on valley floors and gently sloping thalwegs (up to the 5 m cap) and smaller ones on steep hillslopes and next to outcrops.
zmax enters the result three times: (1) in the infinite slope, the weight of the column grows with Z and the share of cohesion in FS decreases — thick soils fail with less pore pressure; (2) the impermeable base is where water accumulates and pressure rises; (3) the volume of each unstable cell is Apx·Zcr, with Zcr ≤ zmax. Getting the thickness wrong by a factor of 2 changes the volume by a factor of 2 even if the instability map is right.
7.8.3 Initial water table and background flux
There is no water-table (WT) measurement in the watershed. Decision D6 defines scenarios of initial WT depth, d = 1, 2, …, 10 m, capped at the base of the soil:
so that, since zmax ≤ 5 m, every scenario with d ≥ 5 m is equivalent to the WT at the base (Figure 7.28). In the calibration, the WT enters as a fraction of the thickness, depthwt = fNA·zmax, with fNA ∈ {0.5; 0.75; 1} (calibrated: 0.50). Without this degree of freedom, the a priori model, with the WT at the base and the central α, is too stable: the a priori run has a TPR of 0.06 and 1.0% of the window unstable (Table 7.36), because the profile above the capillary fringe stays dry and the event rainfall does not manage to saturate it (METODO-PIPELINE §6). The fraction is an effective parameter, not a measured WT: it represents the moisture left by the rainfall before the event, and a single fraction for the whole watershed ignores topographic convergence. fNA = 0.5 is equivalent to a storm state and should be read as an upper bound of the initial moisture (report 13b). The design volumes (Section 7.10) hold for the calibrated initial condition, kept the same in the present and in the future.
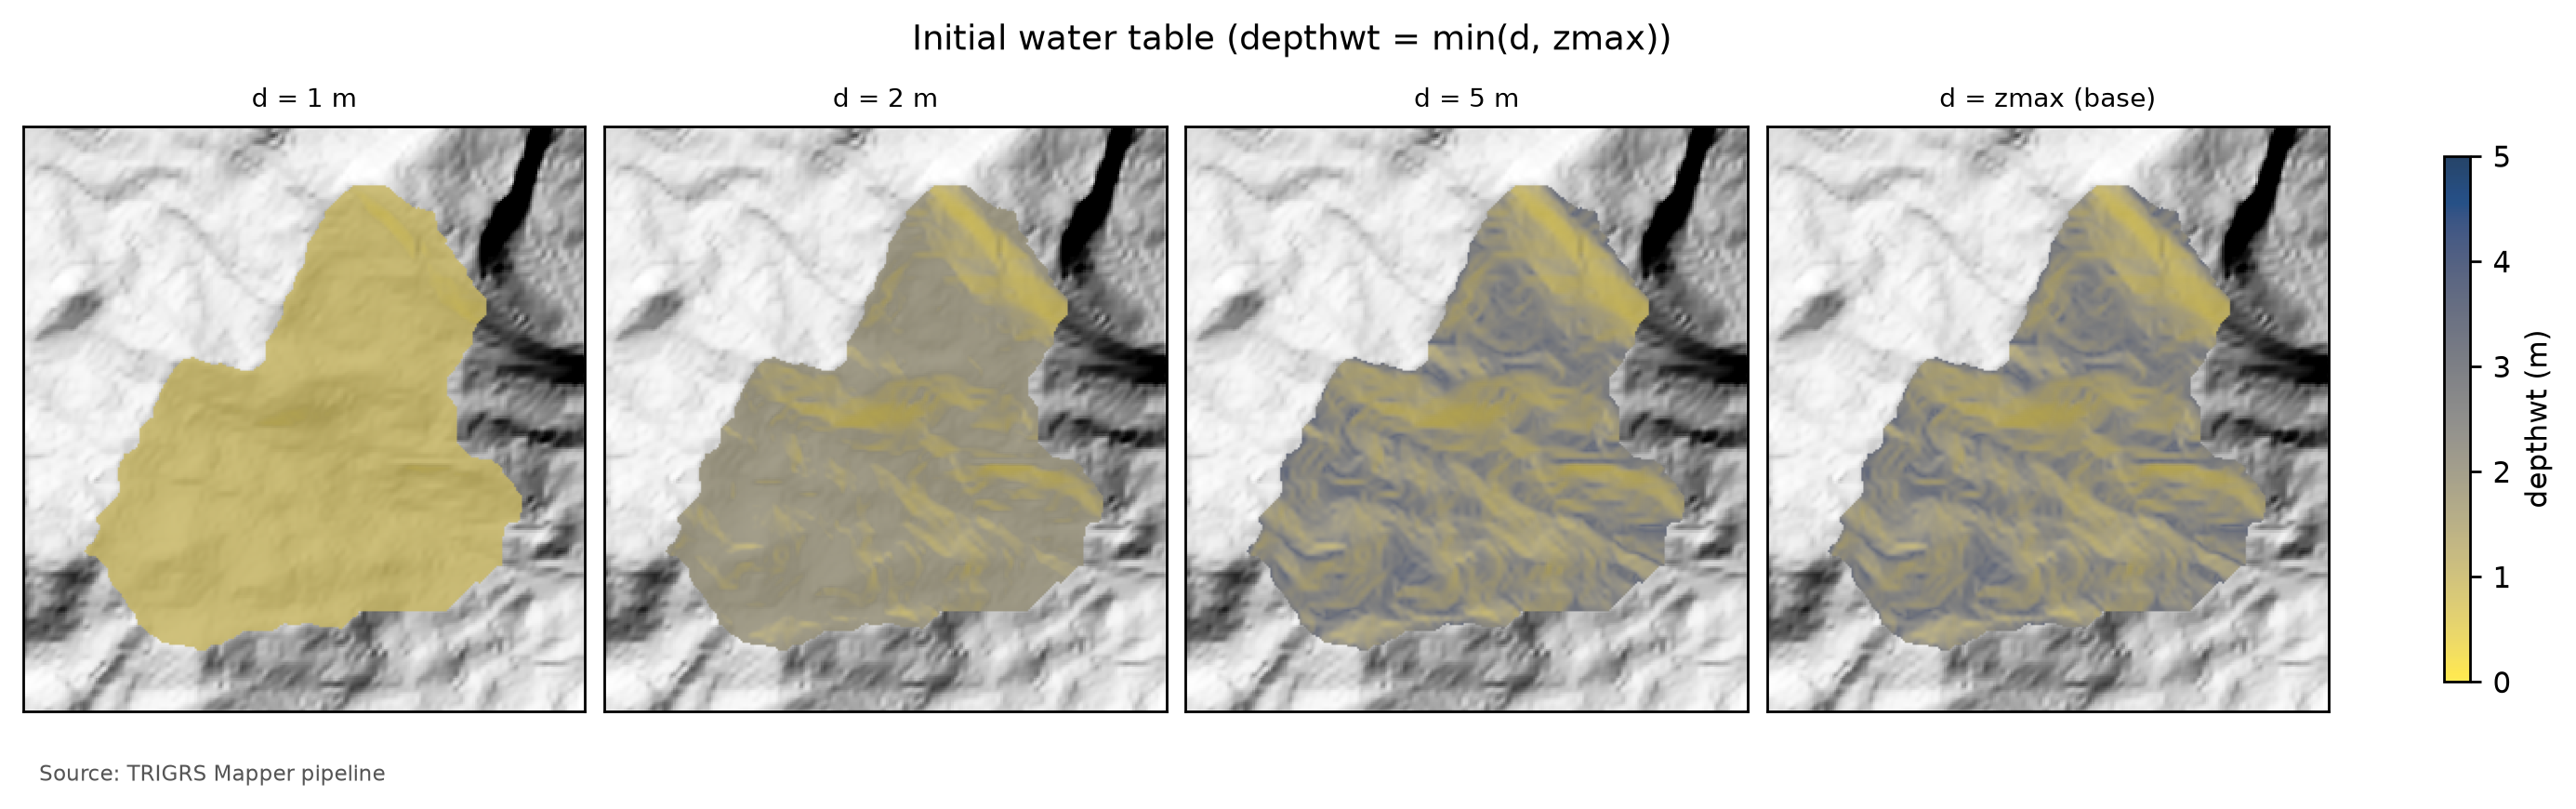
zmax) in the watershed for d = 1, 2 and 5 m and for d = zmax (WT at the base of the soil). From d = 5 m on, the WT lies at the base throughout the watershed, because zmax does not exceed 5 m.
The long antecedent rainfall enters through the steady background flux rizero (Baum et al., 2010; Raia et al., 2014). The value suggested by the December 2010 antecedent rainfall (9.43 × 10⁻⁸ m/s, Section 7.5.7) exceeds the ceiling of the recommended range, 1 × 10⁻⁹ to 5 × 10⁻⁸ m/s (report 04 §4.5); the a priori run therefore uses 5.00 × 10⁻⁸ m/s (suggestion capped at the range: yes). In each cell, rizero ≤ 0.5·Ks, because TRIGRS requires rizero < Ks. In the calibration, rizero is sampled within this range on a logarithmic scale (calibrated: 1.47 × 10⁻⁹ m/s).
TRIGRS starts from a steady initial condition — the initial water table (depthwt) and the background flux (rizero) — and adds to it the transient effect of the rainfall. At t = 0, before any rainfall of the simulated window, every cell already has a factor of safety, FS0. If the parameter combination (high WT, low cohesion, thick soil) leaves FS0 < 1, the model declares the cell unstable before the event, although the hillslopes that failed in 2011 were standing until the storm. The pipeline computes FS0 in closed form, without running the model (trigrs_mapper.trigrs.fs_inicial, the same steady-state solution as TRIGRS, checked against the executable: the stable/unstable class matches in virtually every cell; report 13d).
In the calibration runs, nearly all the instability before the event comes from this initial condition — not from the antecedent rainfall nor from a lack of numerical convergence (Section 7.8.5). In Teresópolis, the two antecedent days of the simulated window were dry (Section 7.5.7), and the state “before the event” coincides with the state at t = 0. Since decision D21, the pipeline separates the cells already unstable at t = 0 (FS0 < 1) from those triggered by the rainfall (FS0 ≥ 1 and minimum FS < 1) in the choice of parameters (Section 7.9.4), in the volumes (Section 7.10.2) and in the thresholds (Section 7.10.6).
7.8.4 Unsaturated zone: the Gardner model
Above the WT the soil is unsaturated: suction (negative pressure) increases strength, and the rainfall must first fill the pores before pressure rises. TRIGRS represents this zone with the exponential model of Gardner (1958),
with the analytical solution of Srivastava & Yeh (1991) for vertical infiltration down to the WT, coupled with pressure diffusion in the saturated zone (Iverson, 2000; Baum et al., 2010). The parameter α (1/m) controls the shape of the retention curve: with a large α the soil drains and loses suction quickly (a capillary fringe of small height ~1/α); with a small α suction persists. A zone with α ≤ 0 is treated as saturated from the start — here, only the outcrop. The unsaturated mode is the main configuration (report 04 §8), because the mechanisms described in the region, the loss of suction as the wetting front advances and the perched water table on the less permeable contact, depend on this storage; the saturated mode, faster and conservative, enters the sensitivity analysis.
The saturated hydraulic diffusivity is written as \(D_0 = r_{D_0} K_s\), with \(r_{D_0}\) = 200 m a priori (range of 10 to 500 m; Park et al., 2013), and controls the delay of the pore-pressure response. The order of magnitude of this delay is the travel time of the wetting front, \(t \approx Z\,(\theta_s - \theta_r)/K_s\): with the central values of the colluvium (θs − θr = 0.40; Ks = 1 × 10⁻⁵ m/s), the front takes about 8 × 10⁴ s ≈ 22 h to reach 2 m — which is the origin of the 24-h rain-free window that follows the design hyetographs (METODO-PIPELINE §5).
7.8.5 Discretization, control and the tr_in.txt file
Table 7.32 summarizes the control parameters read from the tr_in.txt files actually run: the design run in the watershed and the best calibration run in the window. The ones that matter most:
nzs— number of depth increments; Δz = (zmax − zmin)/nzs sets the resolution of Zcr (TRz_at_fs_min). The calibration usesnzs= 20 and the final runsnzs= 30, i.e., Δz ≤ 0.1 m forzmax≤ 3 m (D20).txand the time step — in unsaturated mode the step is uniform, Δt = t/(nper·tx). The pipeline choosestxso that Δt does not exceed the shortest interval between outputs and rounds the output times to multiples of Δt (TRIGRS itself would change them without warning); convergence with tx = 1, 3 and 5 was checked in Nova Friburgo (METODO-PIPELINE §10).nmaxandmmax— maximum number of terms of the series in the analytical solutions; when the series does not converge in a cell, TRIGRS logs it as non-convergent (TrigrsLog.txt). Withnmax= 30, 18% of the cells of a Petrópolis run did not converge in the unsaturated zone (METODO-PIPELINE §10). The full calibration usesnmax= 100, and the selection therefore has a numerical-validity filter (at most 1% of non-convergent cells, Section 7.9.4). In the D21 test (Nova Friburgo window, with the best set of the smoke test),nmax= 100 still left about a third of the cells without convergence — all of them stable, with no metric changed — andnmax= 300 removed the problem at +1.5% CPU (1,000 added nothing). The steps after the calibration (event, design, sensitivity and thresholds) use 300; the calibration keeps 100 becausenmaxenters the signature of the 151 runs, which would otherwise have to be redone. The smoke test used 30 in the calibration.Min_Slope_Angle— flatter cells are not analyzed. In the calibration it is 10°: with c′ ≥ 0 and φ′ ≥ 21°, the infinite slope does not fail below ~10° even when saturated (report 04 §9).flowdir = gener— general direction of the infiltration flow;hydro(no drainage at the base) enters the sensitivity analysis.- Rainfall —
cri(intensity of each period, m/s = mm/h ÷ 3.6 × 10⁶) andcapt(switching times, s), with uniform intensity over the watershed in each period; the excess over Ks becomes surface runoff, routed by the D8 of TopoIndex until it infiltrates downslope.
tr_in.txt files: design run in the watershed (data/cases/teresopolis/runs/projeto/tr100_presente_atual_obs/tr_in.txt) and best calibration run in the window (data/cases/teresopolis/runs/calibracao/lhs/lhs_0019/tr_in.txt).
| Parameter | Design run — 10 m watershed (100-yr, present) | Calibration — 30 m window (best sample) | Meaning |
|---|---|---|---|
| Infiltration model | unsaturated, finite depth (unsfin) |
unsaturated, finite depth (unsfin) |
α > 0 in the soil zones; α ≤ 0 (outcrop) → saturated infiltration |
nzs |
30 | 20 | depth increments (Δz ≈ zmax/nzs) |
tx |
1 | 1 | time-step subdivision |
nmax |
300 | 100 | maximum number of series terms (convergence) |
mmax |
100 | 100 | maximum number of series terms (convergence) |
zmin (m) |
0.10 | 0.10 | minimum computation depth |
Min_Slope_Angle (°) |
0 | 10 | flatter cells are not analyzed |
flowdir |
gener |
gener |
infiltration flow direction |
nper (rainfall periods) |
24 | 38 | rainfall blocks of the run |
t (h) |
48.0 | 120.0 | simulated duration (rain + rain-free window) |
| Δt = t/(kper·tx) (h) | 1.92 | 3.16 | time step of the unsaturated model |
| Output times | 24 | 3 | grids written during the run |
| Zones (saturated) | 8 (0) | 16 (1) | property zones (with α ≤ 0) |
The complete file of the TR 100-year design run, annotated line by line, is in the box below (click to open); the zones follow the numbering of Table 7.30. Compare it with the tr_in.txt of the tutorial example (chapter 4): the structure is the same; the number of zones, the design rainfall and the grids change.
tr_in.txt of the design run (100-yr, present), annotated line by line
File data/cases/teresopolis/runs/projeto/tr100_presente_atual_obs/tr_in.txt, written by trigrs_mapper.trigrs and read by TRIGRS 2.1. The text lines are labels that the program reads and ignores; each number below the block annotates the marked line of values. The zones are those of the design parameterization (land cover MapBiomas 2025; 8 zones), numbered as in the design zone table; the event run and the calibration use the event land cover (GLAD GLCLUC 2010; 9 zones in the watershed) and a different numbering (event zone table).
tr_in.txt
Name of project (up to 255 characters)
1TRIGRS Mapper teresopolis bacia 10 m
tx, nmax, mmax, zones
21, 300, 100, 8
nzs,  zmin,  uww,    nper    t
330, 0.1, 9810.0, 24, 172800.0
zmax,   depth,   rizero,  Min_Slope_Angle (degrees), Max_Slope_Angle (degrees)
4-1.0, -1.0, -1.0, 0.0, 90.0
zone, 1
cohesion,phi,  uws,   diffus,   K-sat, Theta-sat,Theta-res,Alpha
55602.637438498691, 34.945633774205305, 18022.932, 0.0002744201025695286, 7.015609100955407e-06, 0.48, 0.08, 2.8497359566952434
zone, 2
cohesion,phi,  uws,   diffus,   K-sat, Theta-sat,Theta-res,Alpha
63474.984208701129, 34.945633774205305, 18022.932, 0.0002744201025695286, 7.015609100955407e-06, 0.48, 0.08, 2.8497359566952434
zone, 3
cohesion,phi,  uws,   diffus,   K-sat, Theta-sat,Theta-res,Alpha
77446.481748788874, 35.95783354114205, 17805.149999999998, 0.0002744201025695286, 7.015609100955407e-06, 0.5, 0.1, 3.989630339373341
zone, 4
cohesion,phi,  uws,   diffus,   K-sat, Theta-sat,Theta-res,Alpha
85318.828518991311, 35.95783354114205, 17805.149999999998, 0.0002744201025695286, 7.015609100955407e-06, 0.5, 0.1, 3.989630339373341
zone, 5
cohesion,phi,  uws,   diffus,   K-sat, Theta-sat,Theta-res,Alpha
97446.481748788874, 35.95783354114205, 17805.149999999998, 0.0002744201025695286, 7.015609100955407e-06, 0.5, 0.1, 3.989630339373341
zone, 6
cohesion,phi,  uws,   diffus,   K-sat, Theta-sat,Theta-res,Alpha
105318.828518991311, 35.95783354114205, 17805.149999999998, 0.0002744201025695286, 7.015609100955407e-06, 0.5, 0.1, 3.989630339373341
zone, 7
cohesion,phi,  uws,   diffus,   K-sat, Theta-sat,Theta-res,Alpha
113758.793128208508, 36.96884583477373, 19602.341999999997, 0.001372100512847643, 3.5078045504777035e-05, 0.38, 0.05, 4.55957753071239
zone, 8
cohesion,phi,  uws,   diffus,   K-sat, Theta-sat,Theta-res,Alpha
121631.1398984109455, 36.96884583477373, 19602.341999999997, 0.001372100512847643, 3.5078045504777035e-05, 0.38, 0.05, 4.55957753071239
cri(1), cri(2), ..., cri(nper)
136.177222222222222e-07, 6.633611111111112e-07, 7.176111111111111e-07, 7.833333333333333e-07, 8.648333333333334e-07, 9.135e-07, 9.69e-07, 1.2555e-06, 1.8986944444444444e-06, 2.66275e-06, 4.038694444444445e-06, 2.527377777777778e-05, 5.859583333333333e-06, 3.179388888888889e-06, 2.3122777777777775e-06, 1.7118333333333335e-06, 1.1515277777777778e-06, 9.356388888888889e-07, 8.696388888888889e-07, 8.217777777777778e-07, 7.488333333333333e-07, 6.892777777777777e-07, 6.396111111111111e-07, 5.975e-07
capt(1), capt(2), ..., capt(n), capt(n+1)
140.0, 3600.0, 7200.0, 10800.0, 14400.0, 18000.0, 21600.0, 25200.0, 28800.0, 32400.0, 36000.0, 39600.0, 43200.0, 46800.0, 50400.0, 54000.0, 57600.0, 61200.0, 64800.0, 68400.0, 72000.0, 75600.0, 79200.0, 82800.0, 86400.0
File name of slope angle grid (slofil)
15data/slope.asc
File name of digital elevation grid (elevfil)
16data/dem.asc
File name of property zone grid (zonfil)
17data/zones.asc
File name of depth grid (zfil)
18data/zmax.asc
File name of initial depth of water table grid   (depfil)
19data/depthwt.asc
File name of initial infiltration rate grid   (rizerofil)
20data/rizero.asc
List of file name(s) of rainfall intensity for each period, (rifil())
21none
none
none
none
none
none
none
none
none
none
none
none
none
none
none
none
none
none
none
none
none
none
none
none
File name of grid of D8 runoff receptor cell numbers (nxtfil)
22data/TIdscelGrid_prj.txt
File name of list of cells defining runoff computation order (ndxfil)
23data/TIcelindxList_prj.txt
File name of list of all runoff receptor cells  (dscfil)
24data/TIdscelList_prj.txt
File name of list of runoff weighting factors  (wffil)
25data/TIwfactorList_prj.txt
Folder where output grid files will be stored  (folder)
26Resultados/
Identification code to be added to names of output files (suffix)
27prj
Save grid files of runoff? Enter T (.true.) or F (.false.)
28F
Save grid of minimum factor of safety? Enter T (.true.) or F (.false.)
29T
Save grid of depth of minimum factor of safety? Enter T (.true.) or F (.false.)
30T
Save grid of pressure head at depth of minimum factor of safety? Enter T (.true.) or F (.false.)
31T
Save grid of computed water table depth or elevation? Enter T (.true.) or F (.false.) followed by 'depth,' or 'eleva'
32F, depth
Save grid files of actual infiltration rate? Enter T (.true.) or F (.false.)
33F
Save grid files of unsaturated zone basal flux? Enter T (.true.) or F (.false.)
34F
Save listing of pressure head and factor of safety ("flag")? (-9 sparse xmdv , -8 down-sampled xmdv, -7 full xmdv, -6 sparse ijz, -5 down-sampled ijz, -4 full ijz, -3 Z-P-Fs-saturation list -2 detailed Z-P-Fs, -1 Z-P-Fs list, 0 none). Enter flag value followed by down-sampling interval (integer).
350, 1
Number of times to save output grids and (or) ijz/xmdv files
3624
Times of output grids and (or) ijz / xmdv files
376912.0, 13824.0, 20736.0, 27648.0, 34560.0, 41472.0, 48384.0, 55296.0, 62208.0, 69120.0, 76032.0, 82944.0, 96768.0, 103680.0, 110592.0, 117504.0, 124416.0, 131328.0, 138240.0, 145152.0, 152064.0, 158976.0, 165888.0, 172800.0
Skip other timesteps? Enter T (.true.) or F (.false.)
38F
Use analytic solution for fillable porosity?  Enter T (.true.) or F (.false.)
39T
Estimate positive pressure head in rising water table zone (i.e. in lower part of unsat zone)?  Enter T (.true.) or F (.false.)
40T
Use psi0=-1/alpha? Enter T (.true.) or F (.false.) (False selects the default value, psi0=0)
41F
Log mass balance results?   Enter T (.true.) or F (.false.)
42F
Flow direction (Enter "gener", "slope", or "hydro")
43gener
Add steady background flux to transient infiltration rate to prevent drying beyond the initial conditions during periods of zero infiltration?
44T
Specify file extension for output grids. Enter T (.true.) for ".asc" or F for ".txt"
45T
Ignore negative pressure head in computing factor of safety (saturated infiltration only)?   Enter T (.true.) or F (.false.)
46T
Ignore height of capillary fringe in computing pressure head for unsaturated infiltration option?   Enter T (.true.) or F (.false.)
47T
Parameters for deep pressure-head estimate in SCOOPS ijz output: Depth below ground surface (positive, use negative value to cancel this option), pressure option (enter 'zero' , 'flow' , 'hydr' , or 'relh')
48-50.0, flow- 1
- Run title (free text, up to 255 characters).
- 2
-
tx= 1: time-step subdivision (unsaturated model: Δt = t/(kper·tx), kper = number of periods; TRIGRS increasestxwhen needed to separate the output times);nmax= 300 andmmax= 100: maximum number of terms in the series of the infiltration solutions;zones= 8 property zones. - 3
-
nzs= 30 depth increments (Δz ≈ zmax/30);zmin= 0.1 m (minimum computation depth);uww= 9,810 N/m³ (unit weight of water);nper= 24 rainfall periods;t= 172,800 s = 48.0 h simulated (24.0 h of rain + 24.0 h without rain). - 4
-
Negative values:
zmax,depthandrizeroare read cell by cell from the gridszmax.asc,depthwt.ascandrizero.asc; slopes analyzed from 0° to 90° (Min_Slope_Angle,Max_Slope_Angle). - 5
- Zone 1 (colluvium, G1 forest): c = 5,603 Pa (c′ + root cohesion), φ′ = 34.9°, γs = 18,023 N/m³, D0 = 2.74 × 10⁻⁴ m²/s, Ks = 7.02 × 10⁻⁶ m/s, θs = 0.48, θr = 0.08, α = 2.85 1/m.
- 6
- Zone 2 (colluvium, G3 grassland/pasture): c = 3,475 Pa (c′ + root cohesion), φ′ = 34.9°, γs = 18,023 N/m³, D0 = 2.74 × 10⁻⁴ m²/s, Ks = 7.02 × 10⁻⁶ m/s, θs = 0.48, θr = 0.08, α = 2.85 1/m.
- 7
- Zone 3 (mature residual soil, granite, G1 forest): c = 7,446 Pa (c′ + root cohesion), φ′ = 36.0°, γs = 17,805 N/m³, D0 = 2.74 × 10⁻⁴ m²/s, Ks = 7.02 × 10⁻⁶ m/s, θs = 0.50, θr = 0.10, α = 3.99 1/m.
- 8
- Zone 4 (mature residual soil, granite, G3 grassland/pasture): c = 5,319 Pa (c′ + root cohesion), φ′ = 36.0°, γs = 17,805 N/m³, D0 = 2.74 × 10⁻⁴ m²/s, Ks = 7.02 × 10⁻⁶ m/s, θs = 0.50, θr = 0.10, α = 3.99 1/m.
- 9
- Zone 5 (mature residual soil, orthogneiss, G1 forest): c = 7,446 Pa (c′ + root cohesion), φ′ = 36.0°, γs = 17,805 N/m³, D0 = 2.74 × 10⁻⁴ m²/s, Ks = 7.02 × 10⁻⁶ m/s, θs = 0.50, θr = 0.10, α = 3.99 1/m.
- 10
- Zone 6 (mature residual soil, orthogneiss, G3 grassland/pasture): c = 5,319 Pa (c′ + root cohesion), φ′ = 36.0°, γs = 17,805 N/m³, D0 = 2.74 × 10⁻⁴ m²/s, Ks = 7.02 × 10⁻⁶ m/s, θs = 0.50, θr = 0.10, α = 3.99 1/m.
- 11
- Zone 7 (talus/alluvium deposit, G1 forest): c = 3,759 Pa (c′ + root cohesion), φ′ = 37.0°, γs = 19,602 N/m³, D0 = 1.37 × 10⁻³ m²/s, Ks = 3.51 × 10⁻⁵ m/s, θs = 0.38, θr = 0.05, α = 4.56 1/m.
- 12
- Zone 8 (talus/alluvium deposit, G3 grassland/pasture): c = 1,631 Pa (c′ + root cohesion), φ′ = 37.0°, γs = 19,602 N/m³, D0 = 1.37 × 10⁻³ m²/s, Ks = 3.51 × 10⁻⁵ m/s, θs = 0.38, θr = 0.05, α = 4.56 1/m.
- 13
-
Intensity
criof each of the 24 periods (m/s; × 3.6 × 10⁶ = mm/h): peak of 91.0 mm/h, total of 216.6 mm. - 14
-
Start of each period and end of rain (
capt, s): 24.0 h of rain in 1.0-h blocks. - 15
- Slope grid (degrees).
- 16
- Conditioned DEM (the one used by TopoIndex).
- 17
- Property-zone grid (1…N).
- 18
-
Depth of the impermeable base
zmax(m), per cell. - 19
- Initial water-table depth (m), per cell.
- 20
-
Initial (steady) infiltration
rizero(m/s), per cell. - 21
-
One line per period (24):
none= no rainfall grid — the uniform intensitycriof the period is used. - 22
- TopoIndex: D8 receptor cell of each cell (runoff routing).
- 23
- TopoIndex: runoff computation order.
- 24
- TopoIndex: list of receptor cells.
- 25
- TopoIndex: runoff weighting factors.
- 26
- Output-grid folder (it must exist before the run).
- 27
- Suffix of the output-grid names.
- 28
- Grades de escoamento: no.
- 29
- Grid of the minimum FS in the profile at each output time: yes.
- 30
- Depth of the minimum FS, Z_cr (basis of V_TRIGRS): yes.
- 31
- Pressure head at the depth of the minimum FS: yes.
- 32
- Computed water table: no (this grid differs in TRIGRS-P; D11).
- 33
- Actual infiltration: no.
- 34
- Basal flux of the unsaturated zone: no.
- 35
-
flag= 0: no pressure-head/FS listings by depth. - 36
- 24 output times.
- 37
- Output times (s): from 1.9 h to 48.0 h — the pipeline rounds them to multiples of the time step (METODO-PIPELINE §5).
- 38
- Skip the time steps between outputs: no.
- 39
- Analytic solution for the fillable porosity (rising water table): yes.
- 40
- Positive pressure head in the lower unsaturated zone as the water table rises: yes.
- 41
- ψ0 = −1/α: no (F = default, ψ0 = 0).
- 42
- Mass-balance log: no (costs ~12 % of the run time; METODO-PIPELINE §10).
- 43
-
Infiltration flow direction:
gener(gener= general case;slopeandhydroare the alternatives;hydrois tested in the sensitivity analysis). - 44
- Add the steady background flux to the transient infiltration (prevents drying beyond the initial condition without rain): yes.
- 45
-
.ascextension for the output grids: yes. - 46
- Ignore negative pressure head in the FS (saturated infiltration only): yes.
- 47
- Ignore the capillary-fringe height in the pressure head (unsaturated infiltration): yes.
- 48
- Scoops3D option (deep pressure head) disabled: negative depth.
7.8.6 Runs performed
The strategy follows decision D12: the hundreds of calibration runs use the window at 30 m (close to the native resolution of ANADEM); the calibrated parameters are transferred to the watershed at 10 m, with a verification run in the window at 10 m and the sensitivity to resolution. Teresópolis is the heaviest of the three cases: the watershed has 31,084 cells of 10 m, against 1,124 in Nova Friburgo and 7,712 in Petrópolis — which is why the event run in the watershed uses TRIGRS-P (MPI), identical to the serial version in the FS, Zcr and pore-pressure grids (D11, D13), and the thresholds run at 30 m (D20).
nmax = 100 in the calibration and 300 in the other steps). Current status: final, full.
| Run | Domain | Land cover | Rainfall | Product |
|---|---|---|---|---|
| Calibration | window, 30 m | GLAD 2010 | January 11–12, 2011 event, central scenario, in 2-h blocks | 150 Latin hypercube samples + a priori, chosen by the triggered MSR with filters (D21); cross-validation in Nova Friburgo |
| Event | window, 30 m; watershed, 10 m (TRIGRS-P) | GLAD 2010 | the same, with FS frames every 2 h in the watershed | metrics (total and triggered) and hit map; FS0, FS, Zcr and event volumes (triggered and total) |
| Sensitivity | window, 30 m; watershed, 10 × 30 m | GLAD 2010 | event; minimum and maximum scenarios | 28 one-factor-at-a-time variations |
| Design | watershed, 10 m | MapBiomas 2025 | 24-h hyetographs (+ 24 h without rain), TR from 2 to 500 years | 88 runs (full run: 8 TR × 11 scenarios): Vdy12* of the triggered cells, total as the upper bound and initial share |
| Thresholds | watershed, 30 m | MapBiomas 2025 | uniform rainfall: 7 durations × 4 WT conditions × increasing totals | totals that bring 1% and 5% of the watershed to FS < 1 through triggered cells and Vdy12* up to Vdy2 |
7.9 Calibration against the event scars
Calibrating means choosing, among many plausible parameter combinations, the one that best reproduces where and when the hillslopes failed on January 11–12, 2011 — without inflating the unstable area and without inheriting hillslopes that were already unstable before the rain. There are three ingredients: the event rainfall, the scar inventory and the metrics that compare the FS map with it.
7.9.1 The event rainfall in TRIGRS
The forcing is the hyetograph reconstructed in Section 7.5.7 (hourly MERGE shape scaled by the daily totals; D14) in the central scenario of Table 7.20. Only the last two antecedent days enter the transient window — dry in Teresópolis; the long antecedent period is already in rizero — and the 72 hourly steps of the event are aggregated into 2-h blocks (D20; 1-h blocks would cost about three times more in each of the 151 runs). The window run has 38 rainfall periods, 205.8 mm in total and a peak of 24.3 mm/h — lower than the hourly peak in Table 7.20, because the 2-h average dilutes the most intense hour (Figure 7.29). The uncertainty of the forcing (a factor of nearly three among the sources in Table 7.1) returns in the sensitivity analysis, with the minimum and maximum scenarios.
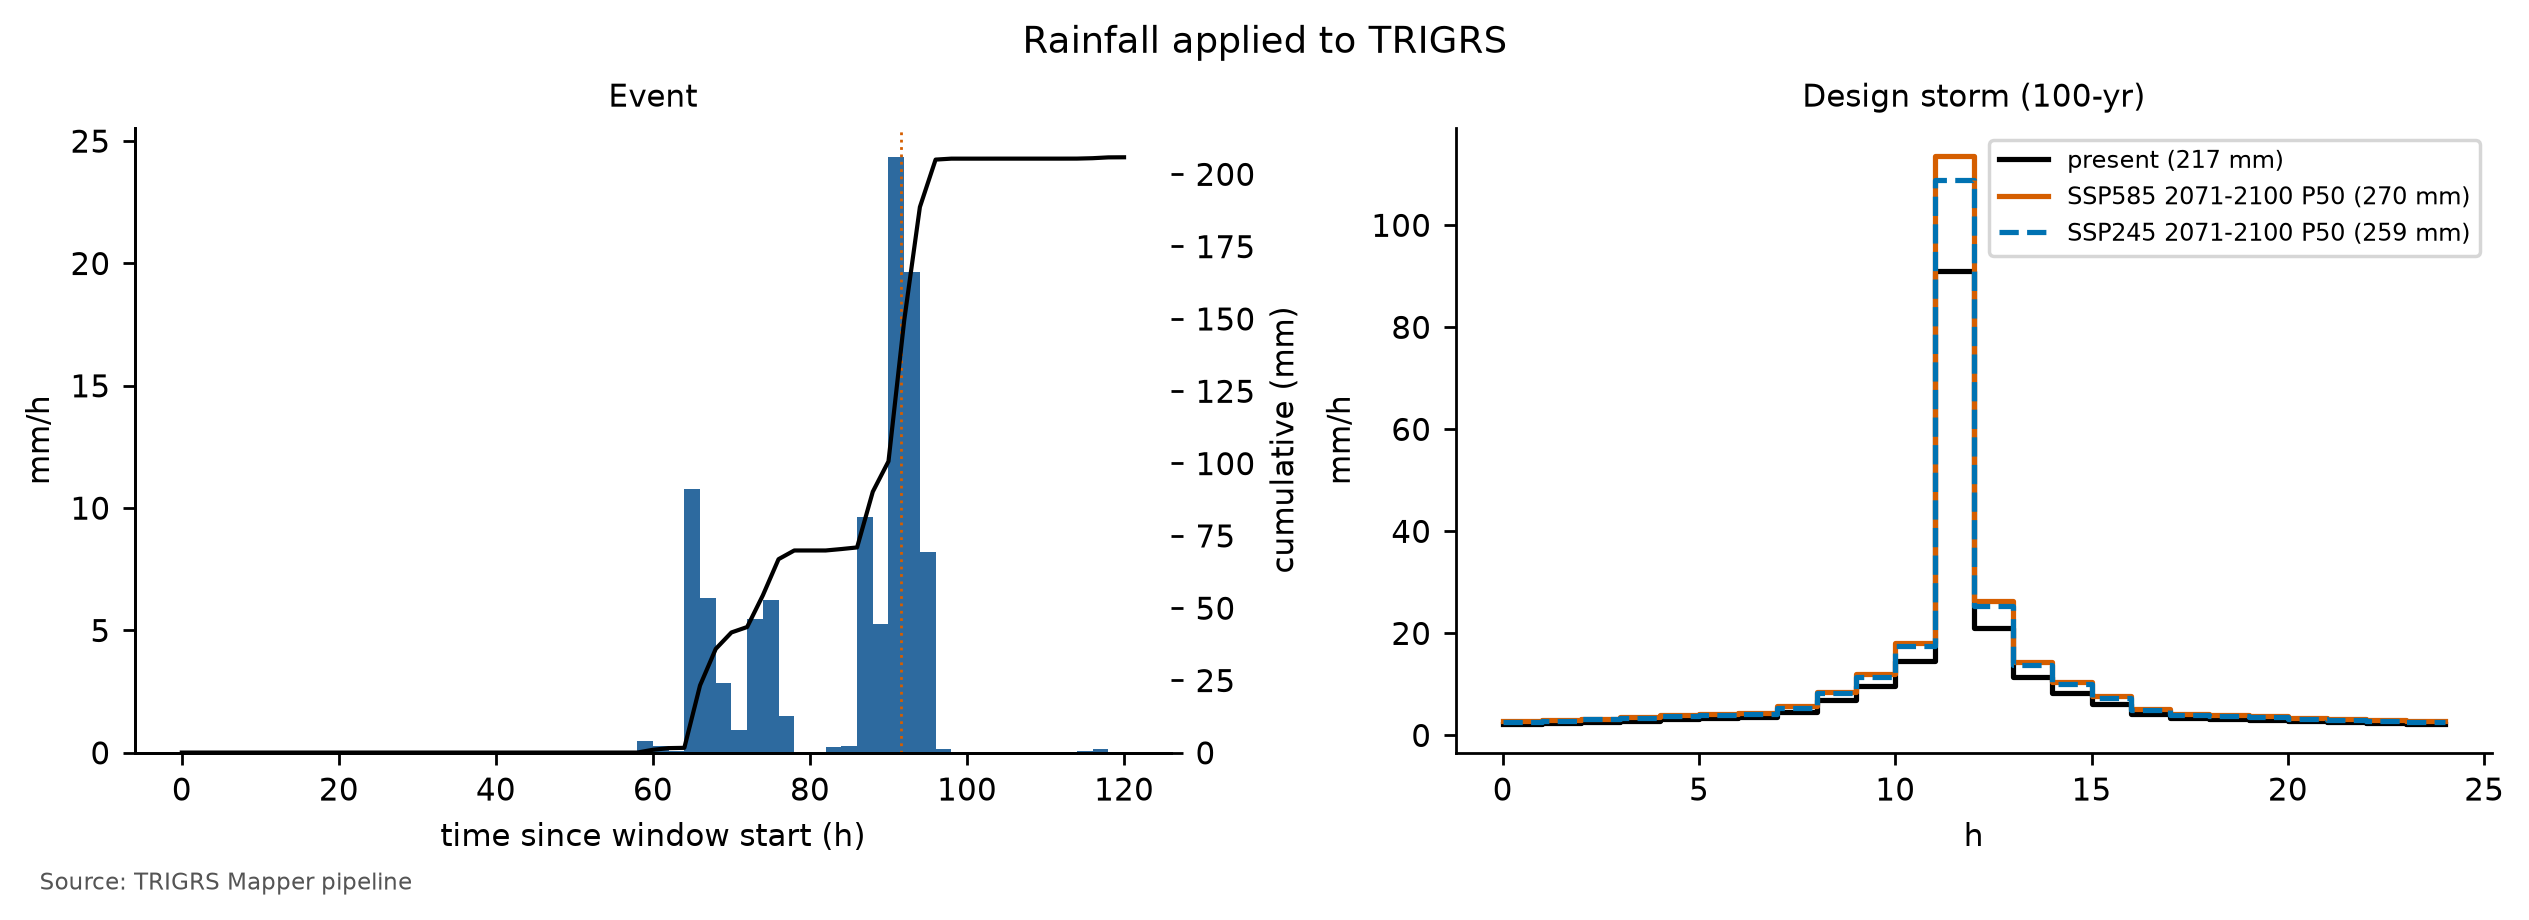
7.9.2 Inventory and source areas
The inventory is that of Marc et al. (2018) and Emberson et al. (2022), mapped manually in this sector and shifted +15 m E and −75 m N (D17), a systematic offset detected in the Landsat and Sentinel-2 images (Figure 7.1). Because each polygon combines failure, track and deposit — and TRIGRS predicts only where failure starts — the comparison uses the approximate source area of each scar: the upper third by elevation, \(z \ge z_{\min} + \tfrac{2}{3}\,(z_{\max} - z_{\min})\). The approximation has independent support: the scar points of the SGB maps that fall inside the Teresópolis polygons lie in their upper part (median relative position of 0.92; report 02). On the 30 m grid:
- positives — cells whose center lies in the source area (at least one per scar) and with slope ≥ 10°;
- excluded — the rest of each polygon (track and deposit), with a one-cell buffer: they count neither as hits nor as errors;
- negatives — the remaining cells of the window.
The window has 318 scars, 647 source cells and 25,735 negative cells. Two caveats: about 40% of the inventory polygons are smaller than a 30 m cell, and ANADEM postdates 2011 — the slopes of the scars are already the post-failure ones (METODO-PIPELINE §11).
TRIGRS answers “does this cell fail?”, not “where does the material travel?”. If the track and the deposit counted as positives, a model that is perfect for failure would be penalized with omissions along the whole debris flow — in the Córrego do Príncipe, kilometers of valley (Section 7.1). Excluding them from the evaluation is more honest than treating them as hits or as errors.
7.9.3 Performance metrics
Each evaluated cell falls into one of the four cells of the confusion matrix (Table 7.34), with “unstable” = minimum FS of the event < 1.
| Source area (2011 scar) | Outside the scars | |
|---|---|---|
| FS < 1 (unstable) | TP — hit | FP — false alarm |
| FS ≥ 1 (stable) | FN — omission | TN — correct stable |
D21 adds the question when. A source cell is a triggered hit (TPd) only if it was stable before the event (FS ≥ 1 at the end of the antecedent period) and became unstable during it; if it was already unstable before, the place is right but the timing is wrong, and it counts as an omission. Outside the scars nothing changes: any unstable cell, before or during the event, is a false alarm — which is why the FPR is the same in both versions.
- TPR (sensitivity) alone rewards the model that declares everything unstable; the FPR measures the stable area predicted as unstable.
- MSR (modified success rate; Huang & Kao, 2006) weighs hits on the sources and on the stable areas equally: 0.5 is chance performance and 1 is perfect. It was the selection objective until D21 and is still reported.
- Triggered MSR (MSRd) — the MSR with the triggered TPR: the selection objective since D21. A null model, with no unstable cell, has MSRd = 0.5; this is why the selection requires a minimum triggered TPR (Section 7.9.4).
- Triggered TSS (TSSd = TPRd − FPR) — together with the AUC, it defines the D21 skill flag: the calibration is “without skill” if TSSd < 0.05 or AUC < 0.60, and the volumes are then presented as a scenario.
- AUC, the area under the ROC curve (Fawcett, 2006), uses the score −FS and sweeps all FS thresholds: it measures whether the sources have a lower FS than the rest of the window, regardless of the cutoff at 1. It is not very sensitive to the parameters and should not be used alone; in the selection, AUC ≥ 0.70 is only an auxiliary sanity constraint.
- Cohen’s (1960) κ, \(\kappa = (p_o - p_e)/(1 - p_e)\), compares the observed agreement with that expected by chance; with source areas so small relative to the window, it stays low even in good models and is only reported.
- LRclass (Park et al., 2013), the ratio between the fraction of the source areas and the fraction of the area in an FS class: above 1, the class concentrates scars (Table 7.39).
- Scars detected — fraction of the scars with at least one unstable source cell.
7.9.4 Latin hypercube and selection
Instead of adjusting each property of each zone, the calibration varies global multipliers (Equation 7.4; Table 7.35). The Latin hypercube (McKay et al., 1979) divides the range of each multiplier into N equiprobable intervals and draws one value per interval, combining them at random: with N runs, each parameter is explored over its whole range, which a regular grid would achieve only with Nk runs for k parameters. The scale is logarithmic for Ks, rD0, α and rizero, which vary over orders of magnitude. The seed (20261031) is the same in the three cases: sample k has the same multipliers in Nova Friburgo, Teresópolis and Petrópolis, which allows cross-validation by ranking (Section 7.9.6).
In the total MSR, a source cell counts as a hit if the minimum FS of the run is < 1 at any time, including before the rain. A parameter set with a high initial WT and low cohesion already starts with unstable hillslopes (FS0 < 1, Section 7.8.3), and the 2011 scars lie precisely on the steep, concave hillslopes, the first to lose stability under a weak initial condition. Such a set “hits” many scars without reproducing the triggering, and the price in false alarms is small, because the FPR is divided by the huge stable area of the window. In the diagnosis made during the full calibration (report 13), the total MSR came to choose in Teresópolis a set in which most of the event’s unstable cells were already unstable before the rain — and the map of FS0 < 1 alone, with no rain at all, already scored well above chance. A purely relative limit (the share of the event’s unstable cells that were already unstable before) was not enough either: it can be met by inflating the event instability. D21 therefore switches the objective to the triggered MSR and imposes absolute limits on the instability before the event, as do the studies that calibrate TRIGRS with event inventories and require hillslopes to be stable before the rain (Zieher et al., 2017; Raia et al., 2014; Schilirò et al., 2015).
The selection (calibration.py) has four steps, recorded in calibracao.json → selecao (Table 7.37):
- Filters, never relaxed — at most 1% of the evaluated cells and 5% of the source cells unstable before the event; at most 30% of the event’s unstable cells already unstable before it; a triggered TPR of at least 0.05. The absolute limits follow the literature cited above, with some slack for the 30 m cells and the two antecedent days; the minimum triggered TPR excludes null or nearly null models, which would have MSRd ≈ 0.5 without hitting anything. If no sample passes, the calibration fails with a record instead of choosing silently.
- Numerical validity — at most 1% of cells without convergence of the series in the run (Section 7.8.5); the filter is dropped only if no sample that passed the filters meets it.
- Auxiliary constraints — median Zcr in the unstable sources between 1 and 2.5 m (depth of the shallow failures observed in the region), unstable area of at most 3 times the source area and AUC ≥ 0.70. If no sample meets them all, they are relaxed cumulatively, in this order — Zcr, area, AUC — and the relaxation is recorded.
- Choice — the sample with the highest triggered MSR among those left.
In the calibration in use, the objective is the triggered MSR; the filters applied are: ≤ 30% of the event’s unstable cells already unstable before it; ≤ 1% of the evaluated cells unstable before the event; ≤ 5% of the source cells unstable before the event; triggered TPR ≥ 0.05; the numerical-validity filter: ≤ 1% of cells without convergence of the series; and the relaxation order, median Z_cr → unstable area → AUC. AUC ≥ 0.70 is not attainable in every case. In the full calibration, the highest AUC among the samples is 0.80 in Teresópolis (range 0.67–0.80), against 0.67 in Nova Friburgo and 0.61 in Petrópolis: in these two cases no sample reaches 0.70 and the constraint ends up relaxed; in Teresópolis it is attainable. The ensemble of the 10 best feasible samples (or of all feasible ones, if fewer) gives a susceptibility map, the fraction of runs with FS < 1, and its own AUC (Figure 7.31).
params.parametrizar). fNA is an effective parameter (wetness left by the previous rains), not a measured water table; the volumes hold for that initial condition.
| Multiplier | Acts on | LHS range | Scale | A priori | Calibrated |
|---|---|---|---|---|---|
| mc | effective cohesion c′ | 0.5–2 | linear | 1.00 | 0.92 |
| mtanφ | tan φ′ | 0.85–1.15 | linear | 1.00 | 1.04 |
| mKs | saturated conductivity Ks | 0.1–10 | logarithmic | 1.00 | 0.70 |
| rD0 (m) | diffusivity D0 = rD0·Ks | 10–500 | logarithmic | 200 | 39 |
| mα | Gardner α (unsaturated) | 0.5–2 | logarithmic | 1.00 | 0.57 |
| mz | soil thickness zmax | 0.6–1.4 | linear | 1.00 | 0.62 |
| kz (1/°) | decay of zmax with slope | 0.025–0.045 | linear | 0.0347 | 0.0269 |
| mCr | root cohesion Cr | 0–1.5 | linear | 1.00 | 1.42 |
| rizero (m/s) | initial (steady) infiltration | 1 × 10⁻⁹ – 5 × 10⁻⁸ | logarithmic | 5.00 × 10⁻⁸ (antecedent 9.43 × 10⁻⁸, capped to the range) | 1.47 × 10⁻⁹ |
| fNA | initial water table = fNA·zmax | {0.5, 0.75, 1} | discrete | 1.00 | 0.50 |
| Metric | Criterion | A priori | Best (lhs_0019) | 2nd (lhs_0105) | 3rd (lhs_0108) |
|---|---|---|---|---|---|
| MSR = (TPR + TNR)/2 | reference (criterion before D21) | 0.53 | 0.56 | 0.55 | 0.56 |
| Triggered MSR = (triggered TPR + TNR)/2 | objective (maximum) | 0.53 | 0.56 | 0.55 | 0.55 |
| AUC (score = −FS) | ≥ 0.70 (relaxable, 3rd) | 0.79 | 0.76 | 0.79 | 0.77 |
| TPR (source areas with FS < 1) | n/a | 0.06 | 0.17 | 0.13 | 0.15 |
| Triggered TPR (FS ≥ 1 before, < 1 in the event) | ≥ 0.05 (filter) | 0.06 | 0.16 | 0.12 | 0.13 |
| FPR (FS < 1 outside the scars) | n/a | 0.01 | 0.04 | 0.02 | 0.03 |
| TSS = TPR − FPR | n/a | 0.05 | 0.13 | 0.11 | 0.12 |
| Triggered TSS = triggered TPR − FPR | skill: ≥ 0.05 | 0.05 | 0.11 | 0.10 | 0.10 |
| Cohen’s kappa | n/a | 0.07 | 0.09 | 0.11 | 0.10 |
| Unstable fraction of the window (%) | n/a | 1.0 | 4.7 | 2.1 | 3.7 |
| Evaluated cells unstable before the event (%) | ≤ 1% (filter) | 0.00 | 0.11 | 0.06 | 0.15 |
| Source cells unstable before the event (%) | ≤ 5% (filter) | 0.0 | 1.5 | 0.5 | 1.9 |
| Event-unstable cells already unstable before (%) | ≤ 30% (filter) | 0.4 | 2.3 | 2.6 | 4.1 |
| Cells without series convergence (%) | ≤ 1% (relaxable filter) | 0.00 | 0.00 | 0.00 | 0.00 |
| Unstable area ÷ source area | ≤ 3.0 (relaxable, 2nd) | 0.4 | 1.9 | 0.9 | 1.5 |
| Median Zcr in unstable sources (m) | 1.0–2.5 (relaxable, 1st) | 1.12 | 1.31 | 1.00 | 1.57 |
| Scars detected | n/a | 35 of 318 (11.0%) | 87 of 318 (27.4%) | 62 of 318 (19.5%) | 77 of 318 (24.2%) |
| Top-10 ensemble AUC (fraction of runs with FS < 1) | n/a | n/a | 0.62 | n/a | n/a |
| Stage | Criteria | Samples left | Failures per criterion |
|---|---|---|---|
| LHS samples with metrics | 150 samples run | 150 | no metrics: 0 |
| Filters (never relaxed) | ≤ 30% of the event’s unstable cells already unstable before it; ≤ 1% of the evaluated cells unstable before the event; ≤ 5% of the source cells unstable before the event; triggered TPR ≥ 0.05 | 33 | pre-event share of unstable cells: 53; evaluated cells unstable before the event: 44; source cells unstable before the event: 46; triggered TPR: 76 |
| Numerical validity (relaxed only if nothing is left) | ≤ 1% of cells without convergence of the series | 26 | numerical validity (series convergence): 28 |
| Auxiliary constraints (all) | median Zcr between 1 and 2.5 m; unstable area ≤ 3× the source area; AUC ≥ 0.70 | 23 | median Z_cr: 40; unstable area: 16; AUC: 5 |
| Choice | triggered MSR (maximum) | lhs_0019 (0.556) | top-3: lhs_0019, lhs_0105, lhs_0108 |
calibracao.json → selecao → contagem_exclusao).
| Reason for exclusion | Samples |
|---|---|
| triggered TPR | 50 |
| pre-event share of unstable cells + evaluated cells unstable before the event + source cells unstable before the event | 26 |
| pre-event share of unstable cells + triggered TPR | 20 |
| evaluated cells unstable before the event + source cells unstable before the event | 12 |
| numerical validity (series convergence) | 7 |
| pre-event share of unstable cells + evaluated cells unstable before the event + source cells unstable before the event + triggered TPR | 6 |
| median Z_cr | 3 |
| source cells unstable before the event | 2 |
| pre-event share of unstable cells | 1 |
Of the 150 samples, the selection stages leave, in sequence: 150 with metrics → 33 after the filters → 26 with numerical validity → 23 with the auxiliary constraints (Table 7.37; reasons for the exclusions in Table 7.38). 23 feasible samples remain, with the relaxed constraints: none. The best one, lhs_0019, has a triggered MSR of 0.56 (a priori: 0.53), triggered TPR = 0.16 (0.06) and triggered TSS = 0.11 (0.05); in the total metrics, MSR = 0.56 (0.53), AUC = 0.76 (0.79), TPR = 0.17 (0.06), FPR = 0.04 (0.01), TSS = 0.13 and κ = 0.09 (0.07). Before the event, 0.11% of the evaluated cells and 1.5% of the source cells were already unstable, and 2.3% of the event’s unstable cells already were before it (filters of 1%, 5% and 30%; a priori: 0.00% and 0.4%); in the best run, 0.00% of the cells did not converge. The unstable fraction of the window goes from 1.0% to 4.7% (1.9 times the source area), the median Zcr in the unstable sources is 1.31 m and 87 scars (27.4%) have at least one unstable source cell. The three best are lhs_0019 (0.556); lhs_0105 (0.552); lhs_0108 (0.550) (by the triggered MSR), and the first beats the second by 0.004: with such small distances, the ensemble, and not only the best sample, is the result to read. The ensemble of the 10 best samples has AUC = 0.62, lower than that of the best sample because its score — the fraction of runs with FS < 1 — has few levels and is zero over most of the window, where none of the samples fails: the ensemble ROC curve has a single useful segment, near the origin (Figure 7.31). Skill flag (D21): minimum skill met (triggered TSS 0.11 ≥ 0.05 and AUC 0.76 ≥ 0.60).
| FS class | A priori: area (%) | A priori: scars (%) | A priori: LR | Best (lhs_0019): area (%) | Best: scars (%) | Best: LR |
|---|---|---|---|---|---|---|
| FS < 1 | 1.0 | 5.9 | 6.05 | 4.7 | 17.2 | 3.64 |
| 1 ≤ FS < 1.3 | 6.1 | 29.8 | 4.85 | 13.9 | 39.6 | 2.85 |
| 1.3 ≤ FS < 1.5 | 7.7 | 22.6 | 2.95 | 10.1 | 11.7 | 1.16 |
| 1.5 ≤ FS < 2 | 23.1 | 24.3 | 1.05 | 25.3 | 17.5 | 0.69 |
| FS ≥ 2 | 62.2 | 17.5 | 0.28 | 46.0 | 14.1 | 0.31 |
Table 7.39 looks at the same result by FS class, without the cutoff at 1. In the best sample, the FS < 1 class holds 17.2% of the source cells in 4.7% of the window (LR = 3.64; a priori, 6.05), and the 1 ≤ FS < 1.3 class has LR = 2.85; in the FS ≥ 2 class, LR = 0.31. LR above 1 in the low-FS classes and below 1 in the high-FS classes indicates that FS ranks the hillslopes in the right direction, even where the cutoff at 1 fails. In both runs, LR decreases monotonically from the FS < 1 class to the FS ≥ 2 class. The a priori run, more selective, concentrates more scars per unit area in the FS < 1 class, but that class holds only 5.9% of the source cells, against 17.2% in the best sample.
The gain of the calibration lies in the difference between the “A priori” and “Best” columns of Table 7.36, read first in the triggered MSR. A triggered MSR that rises because the triggered TPR grows with a low FPR indicates that the multipliers moved the instability to the right hillslopes, at the right time; an MSR that rises at the cost of a large unstable area (ratio close to the limit of 3) indicates only a more “pessimistic” model, which hits more by covering more area; and a total MSR well above the triggered one indicates hits inherited from the initial condition.
How to read the Teresópolis calibration. The selection did not need to relax any constraint — the only one of the three cases where this happens. The filters cut most of the hypercube, for two main reasons (Table 7.38): sets that are too stable, in which the 2011 rainfall does not trigger 5% of the source areas, and sets that already start unstable before the event. Numerical validity removes a few more samples (with nmax = 100, Section 7.8.5), and the auxiliary constraints only a few, all by the median Zcr. The best sample meets the three auxiliary constraints (median Zcr of 1.31 m, unstable area of 1.9 times the source area and AUC of 0.76).
The gain over the a priori run is modest and comes from triggering: the triggered TPR goes from 0.06 to 0.16 and the triggered TSS from 0.05 to 0.11, with an FPR that rises from 0.01 to 0.04; the triggered MSR goes from 0.53 to 0.56, and the total MSR barely departs from it — a sign that the hits do not come from the initial condition. The a priori run is too stable (1.0% of the window unstable), and the calibrated one does not gain by covering area: the unstable area stays well below the limit of 3 times the source area. AUC, in contrast, does not improve (0.79 → 0.76), and not even the best configuration ranks the hillslopes better than slope alone: with the same positive and negative cells, slope has AUC = 0.85, against 0.76 for the calibrated FS. The calibration adjusts the cutoff at FS = 1 and the timing of failure, not the spatial ranking; the value of TRIGRS lies in triggering by rainfall and in the volume, not in a susceptibility map better than that of slope.
The multipliers (Table 7.35) show where the adjustment lies. Strength and permeability stay close to the a priori values (Section 7.8.1); the departures are in thickness (mz = 0.62 and kz = 0.0269 per degree: thinner soils than those of the a priori curve, Figure 7.27), in root cohesion (mCr = 1.42), in α (mα = 0.57), in diffusivity (rD0 = 39 m, against 200 m a priori), in the initial WT (fNA = 0.50, the shallowest WT of the three options) and in the background flux (rizero = 1.47 × 10⁻⁹ m/s, against 5.00 × 10⁻⁸ m/s a priori). Several ended up close to the limits of the hypercube ranges — mz, kz, mα and rizero near the minimum, mCr near the maximum — a sign that the ranges may be constraining the fit (Section 7.11.3). The shallow initial WT with a low background flux is the wet storm state of Section 7.8.3, and the volumes of the following sections hold for it. By the D21 flag, Teresópolis has minimum skill: the volumes are calibrated estimates, not scenarios, although the skill is modest.
The criterion matters. By the total MSR, without the filters, the choice would be different: all samples with a total MSR higher than that of the chosen one fail the filters on instability before the event, and the chosen one is only at position 38 of 150 in that ranking (since it is the same sample as in Nova Friburgo, the position is that of the cross-validation from Nova Friburgo to Teresópolis, Section 7.9.6). At the top of that ranking, most of the event’s unstable cells were already unstable before the rain, and some fall below chance when only the triggered scars count (triggered MSR < 0.5). Their total MSR is much higher than that of the chosen one, but the gain is inherited from the initial condition, not from the rainfall — the symptom described in the box above.
Finally, the sample chosen in Teresópolis, lhs_0019, is the same one chosen in Nova Friburgo (lhs_0019; chapter 6), independently — another window, other scars, another rainfall. This is the strongest indication that the configuration is regional for the 2011 event (Section 7.9.6).
7.9.5 Hits, omissions and false alarms
The event run repeats the calibrated configuration in the 30 m window (metrics and map) and in the 10 m watershed (volumes, Section 7.10). In the window, it gives a triggered MSR of 0.56 (triggered TPR = 0.16; triggered TSS = 0.11), TPR = 0.17, FPR = 0.04, MSR = 0.56, AUC = 0.76 and κ = 0.09, with 87 scars detected (27.4%), for 205.8 mm of rainfall with a peak of 24.3 mm/h; before the event, 0.11% of the window cells were already unstable (2.3% of the event’s unstable cells). Figure 7.30 shows where the hits, omissions and false alarms are; the map classifies by the minimum FS of the whole run (total metrics), and the D21 filters ensure that few of these cells were already unstable before the event. False alarms on steep hillslopes without scars are not necessarily model errors: they may be hillslopes that did not fail in that event, or scars that the inventory did not record. Omissions clustered on one hillslope, in contrast, point to a process that the model does not represent (greater thickness, perched water table, stronger local rainfall).
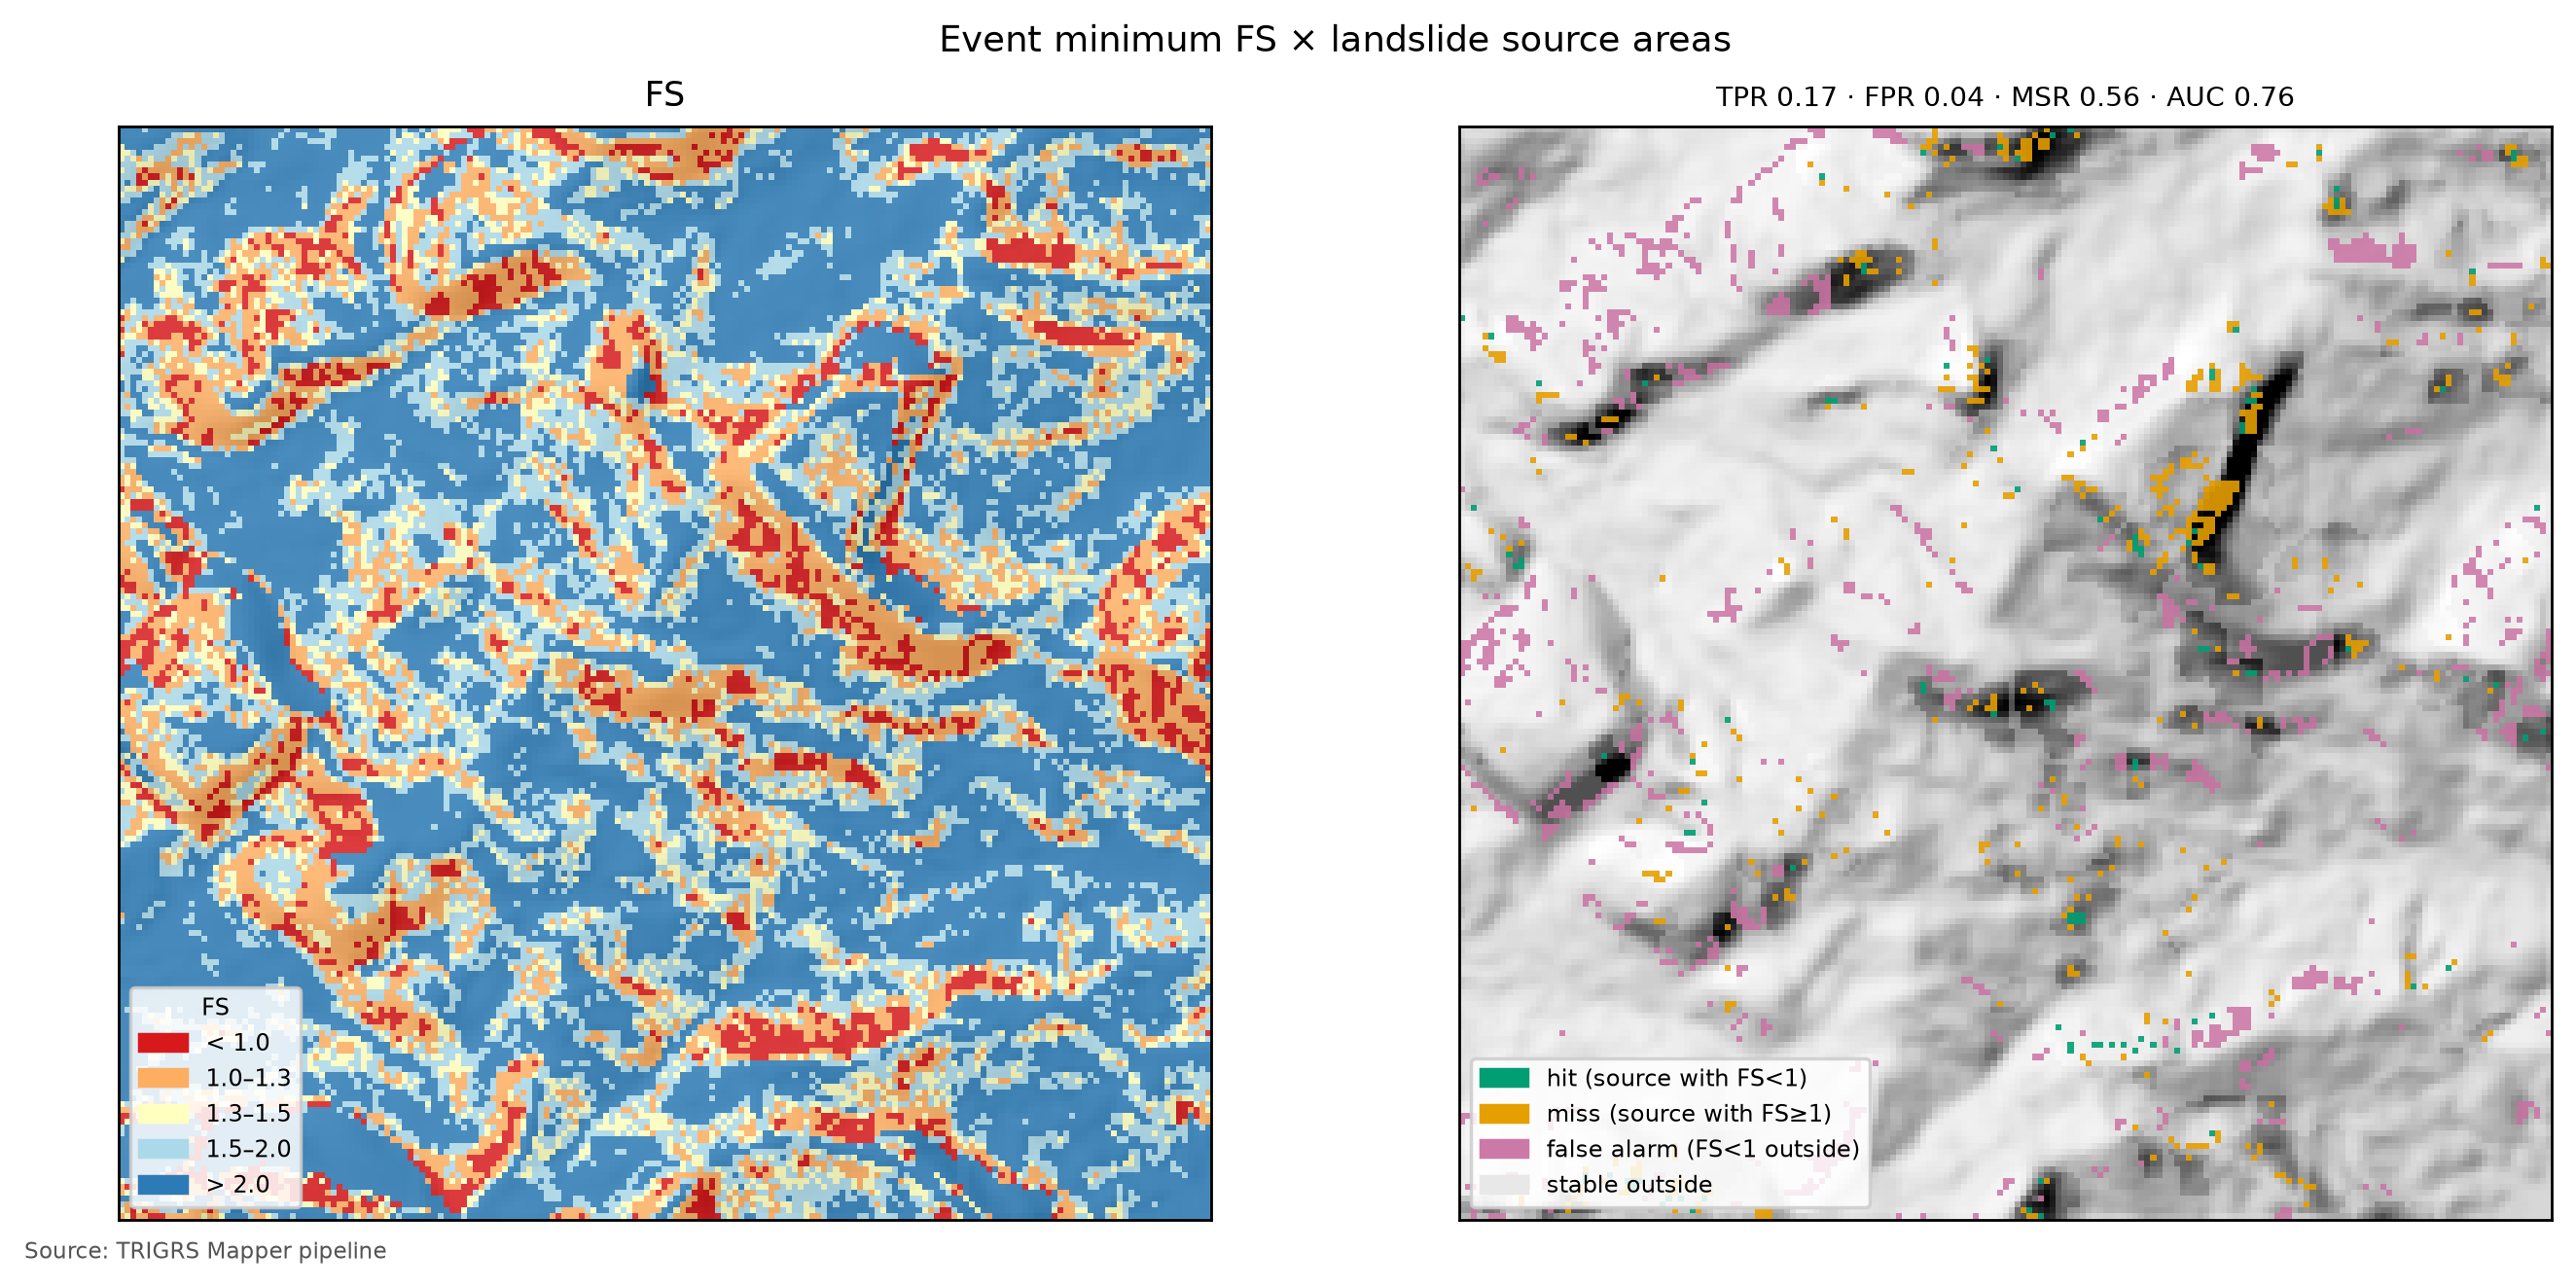
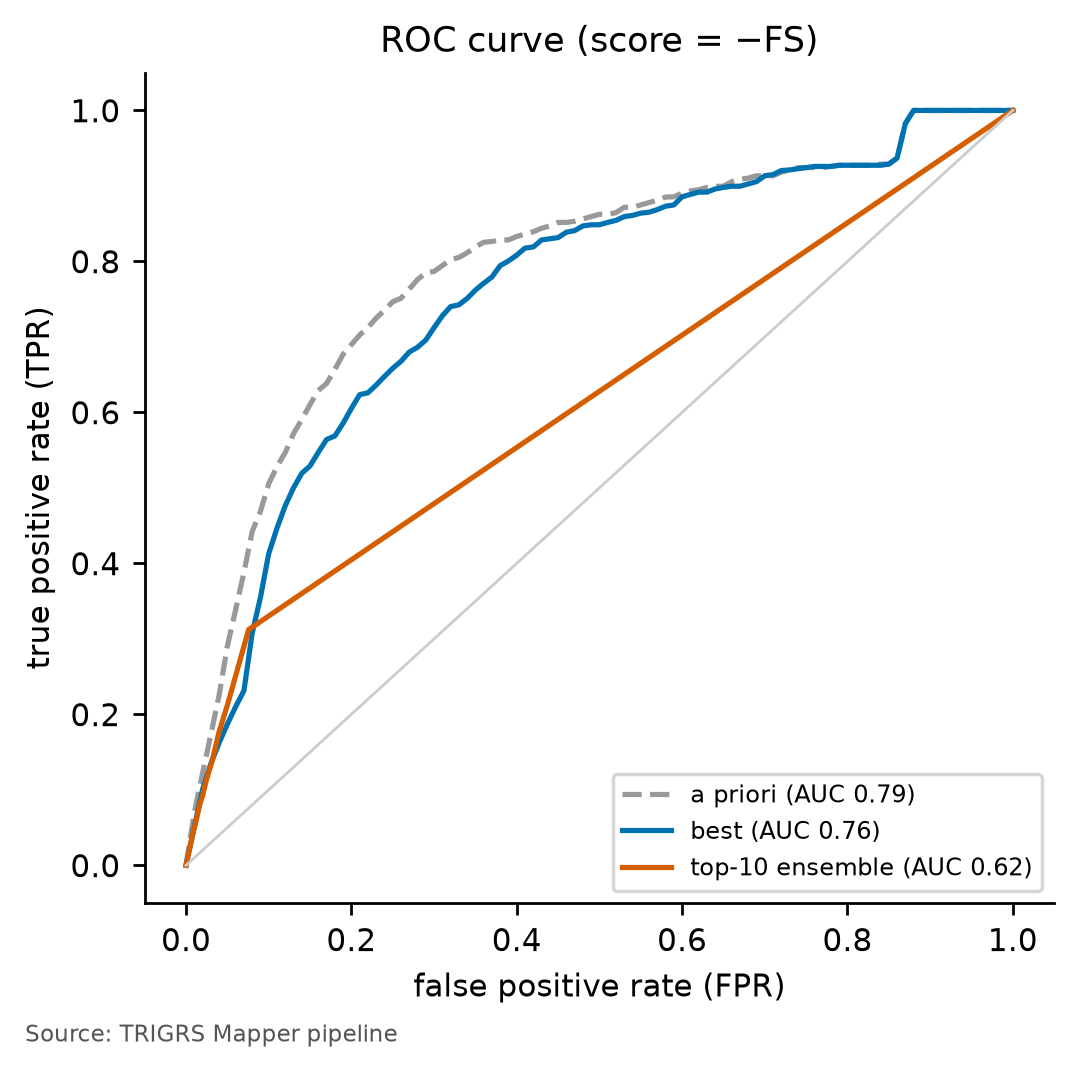
7.9.6 Cross-validation
A good fit in the calibration window itself may be just overfitting. The test is to apply the multipliers to another inventory, with another rainfall, without recalibrating: those of Teresópolis were taken to the Nova Friburgo calibration window, with the event rainfall there (Table 7.40).
| Origin → target (rainfall) | Scars (source cells) | Transferred MSR | A priori MSR | Target MSR | Triggered MSR: transferred / a priori / target | AUC transferred / a priori | Rank in the target LHS (MSR; triggered MSR) |
|---|---|---|---|---|---|---|---|
| Teresópolis → Nova Friburgo (calibration window) (rainfall of Nova Friburgo) | 345 (528) | 0.55 | 0.50 | 0.55 | 0.54 / 0.50 / 0.54 | 0.66 / 0.67 | 15 of 150; 3 of 150 |
In Nova Friburgo (calibration window), the Teresópolis multipliers give a triggered MSR of 0.54, against 0.50 for the a priori run (+0.043) and 0.54 for the best sample calibrated in the target itself; in the total MSR, 0.55 (a priori: 0.50; +0.052; target: 0.55), with AUC = 0.66. Among the samples of the Nova Friburgo hypercube, they rank 3 of 150 by the triggered MSR (15 of 150 by the MSR). In the opposite direction (chapter 6), the Nova Friburgo multipliers applied to the Teresópolis window give a triggered MSR of 0.56 (rank 21 of 150 in the Teresópolis ranking; by the MSR, 0.56 and rank 38 of 150). Since the samples are the same in both cases, transferring amounts to looking up, in the ranking of the target, the sample that won at the origin: if it stays among the first ones — or if the same sample wins in both cases — the effective parameters are regional; if it drops to the middle of the ranking, they depend on the site, the inventory or the event.
Here both directions give the most favorable result possible: the same sample (lhs_0019) won in both calibrations, and transferring the multipliers from one window to the other amounts to running, in the target, its own best sample. That is why the transferred triggered MSR equals that of the target in both directions, and the gain over the a priori run is positive in both (+0.043 in Nova Friburgo and +0.031 in Teresópolis). The positions in the ranking by the triggered MSR (3 of 150 in Nova Friburgo and 21 of 150 in Teresópolis) do not indicate a loss in the transfer: the samples ahead are, in both cases, those that D21 excludes — all for instability before the event, except one in Teresópolis, excluded by the median Zcr. The reading is that of a regional set of effective parameters for the 2011 event in the Rio de Janeiro Highlands, with two caveats: the two windows share the event, the inventory source (Marc et al., 2018) and the a priori parameter table, and the AUC transferred to Nova Friburgo (0.66) does not exceed that of the a priori run there (0.67) — the gain, again, lies in triggering, not in the spatial ranking.
7.9.7 Sensitivity
The sensitivity analysis varies one factor at a time around the calibrated configuration (full calibration, sample lhs_0019) and measures two responses: the MSR (total and triggered) and the AUC in the 30 m window, and the Vdep of the event in the watershed (all unstable cells; the volume forms are in Section 7.10.1). The factors cover physics and data: initial WT d = 1 to 10 m (D6) and fractions 0.5, 0.75 and 1 of zmax; zmax models (DeRose, uniform thicknesses, linear decrease and the BDTICM pattern); Ks × 0.1 and × 10; c′ × 0.5 and × 2; tan φ′ × 0.85 and × 1.15 (limits of the ranges of the parameter table); the minimum and maximum scenarios of the event rainfall (Table 7.20); infiltration limited by SCS-CN (AMC II); the saturated mode; flowdir = hydro; and the resolution of the watershed (10 × 30 m), with the verification run of the calibrated configuration in the window at 10 m (D12). The list of what was actually run is in Table 7.41, and the effect on volume, sorted, in Figure 7.32. The SCS-CN variant, planned in the pipeline, was not run: it depends on the watershed CN read from chuva/cn.json, and the pipeline reader does not recognize the format of the Teresópolis file (the CN of each moisture condition is inside the adotado block).
| Variation | Vdep (m³) | ΔVdep (%) | MSR | ΔMSR | Δ triggered MSR | AUC |
|---|---|---|---|---|---|---|
| base configuration | 231,439 | n/a | 0.56 | n/a | (0.56) | 0.76 |
| initial water table d = 2 m | 28,350 | −87.8 | 0.52 | −0.041 | −0.033 | 0.79 |
| initial water table d = 7 m | 28,350 | −87.8 | 0.52 | −0.041 | −0.033 | 0.79 |
| initial water table d = 6 m | 28,350 | −87.8 | 0.52 | −0.041 | −0.033 | 0.79 |
| initial water table d = 4 m | 28,350 | −87.8 | 0.52 | −0.041 | −0.033 | 0.79 |
| initial water table d = 8 m | 28,350 | −87.8 | 0.52 | −0.041 | −0.033 | 0.79 |
| initial water table d = 3 m | 28,350 | −87.8 | 0.52 | −0.041 | −0.033 | 0.79 |
| initial water table d = 5 m | 28,350 | −87.8 | 0.52 | −0.041 | −0.033 | 0.79 |
| initial water table d = 1 m | 99,438 | −57.0 | 0.54 | −0.027 | −0.019 | 0.76 |
| uniform zmax of 1.25 m | 204,713 | −11.5 | 0.59 | +0.028 | +0.001 | 0.78 |
| initial water table = 0.75·zmax | 96,993 | −58.1 | 0.54 | −0.021 | −0.014 | 0.78 |
| initial water table d = 9 m | 28,350 | −87.8 | 0.52 | −0.041 | −0.033 | 0.79 |
| uniform zmax of 2.0 m | 749,340 | +223.8 | 0.68 | +0.114 | +0.013 | 0.78 |
| zmax: linear (4 → 0.3 m) model | 1,190 | −99.5 | 0.51 | −0.055 | −0.047 | 0.71 |
| initial water table d = 10 m | 28,350 | −87.8 | 0.52 | −0.041 | −0.033 | 0.79 |
| initial water table = 1·zmax | 28,350 | −87.8 | 0.52 | −0.041 | −0.033 | 0.79 |
| initial water table = 0.5·zmax | 231,439 | 0.0 | 0.56 | 0.000 | 0.000 | 0.76 |
| zmax: DeRose model | 1,372 | −99.4 | 0.51 | −0.054 | −0.047 | 0.72 |
| Ks × 10 | 15,128 | −93.5 | 0.52 | −0.045 | −0.045 | 0.76 |
| zmax: regolith (BDTICM) model | 702,732 | +203.6 | 0.64 | +0.078 | −0.019 | 0.78 |
| c′ × 0.5 | 633,589 | +173.8 | 0.68 | +0.121 | +0.081 | 0.77 |
| c′ × 2 | 0 | −100.0 | 0.51 | −0.056 | −0.048 | 0.74 |
| tan φ′ × 0.85 | 381,670 | +64.9 | 0.57 | +0.010 | +0.007 | 0.75 |
| saturated model | 209,574 | −9.4 | 0.55 | −0.010 | −0.010 | 0.73 |
| tan φ′ × 1.15 | 96,738 | −58.2 | 0.55 | −0.019 | −0.012 | 0.77 |
| event rainfall: maximum scenario | 232,938 | +0.6 | 0.57 | +0.001 | +0.001 | 0.75 |
| Ks × 0.1 | 67,592 | −70.8 | 0.53 | −0.032 | −0.032 | 0.79 |
| event rainfall: minimum scenario | 171,326 | −26.0 | 0.55 | −0.010 | −0.010 | 0.76 |
| flowdir = hydro | 907,059 | +291.9 | 0.69 | +0.131 | +0.094 | 0.77 |
| watershed resolution 10 m × 30 m — all unstable cells | 51,143 (30 m: 231,439) | −77.9 | n/a | n/a | n/a | n/a |
| watershed resolution 10 m × 30 m — patch (D19 total, incl. FS0 < 1) | 26,630 (30 m: 222,779) | −88.0 | n/a | n/a | n/a | n/a |
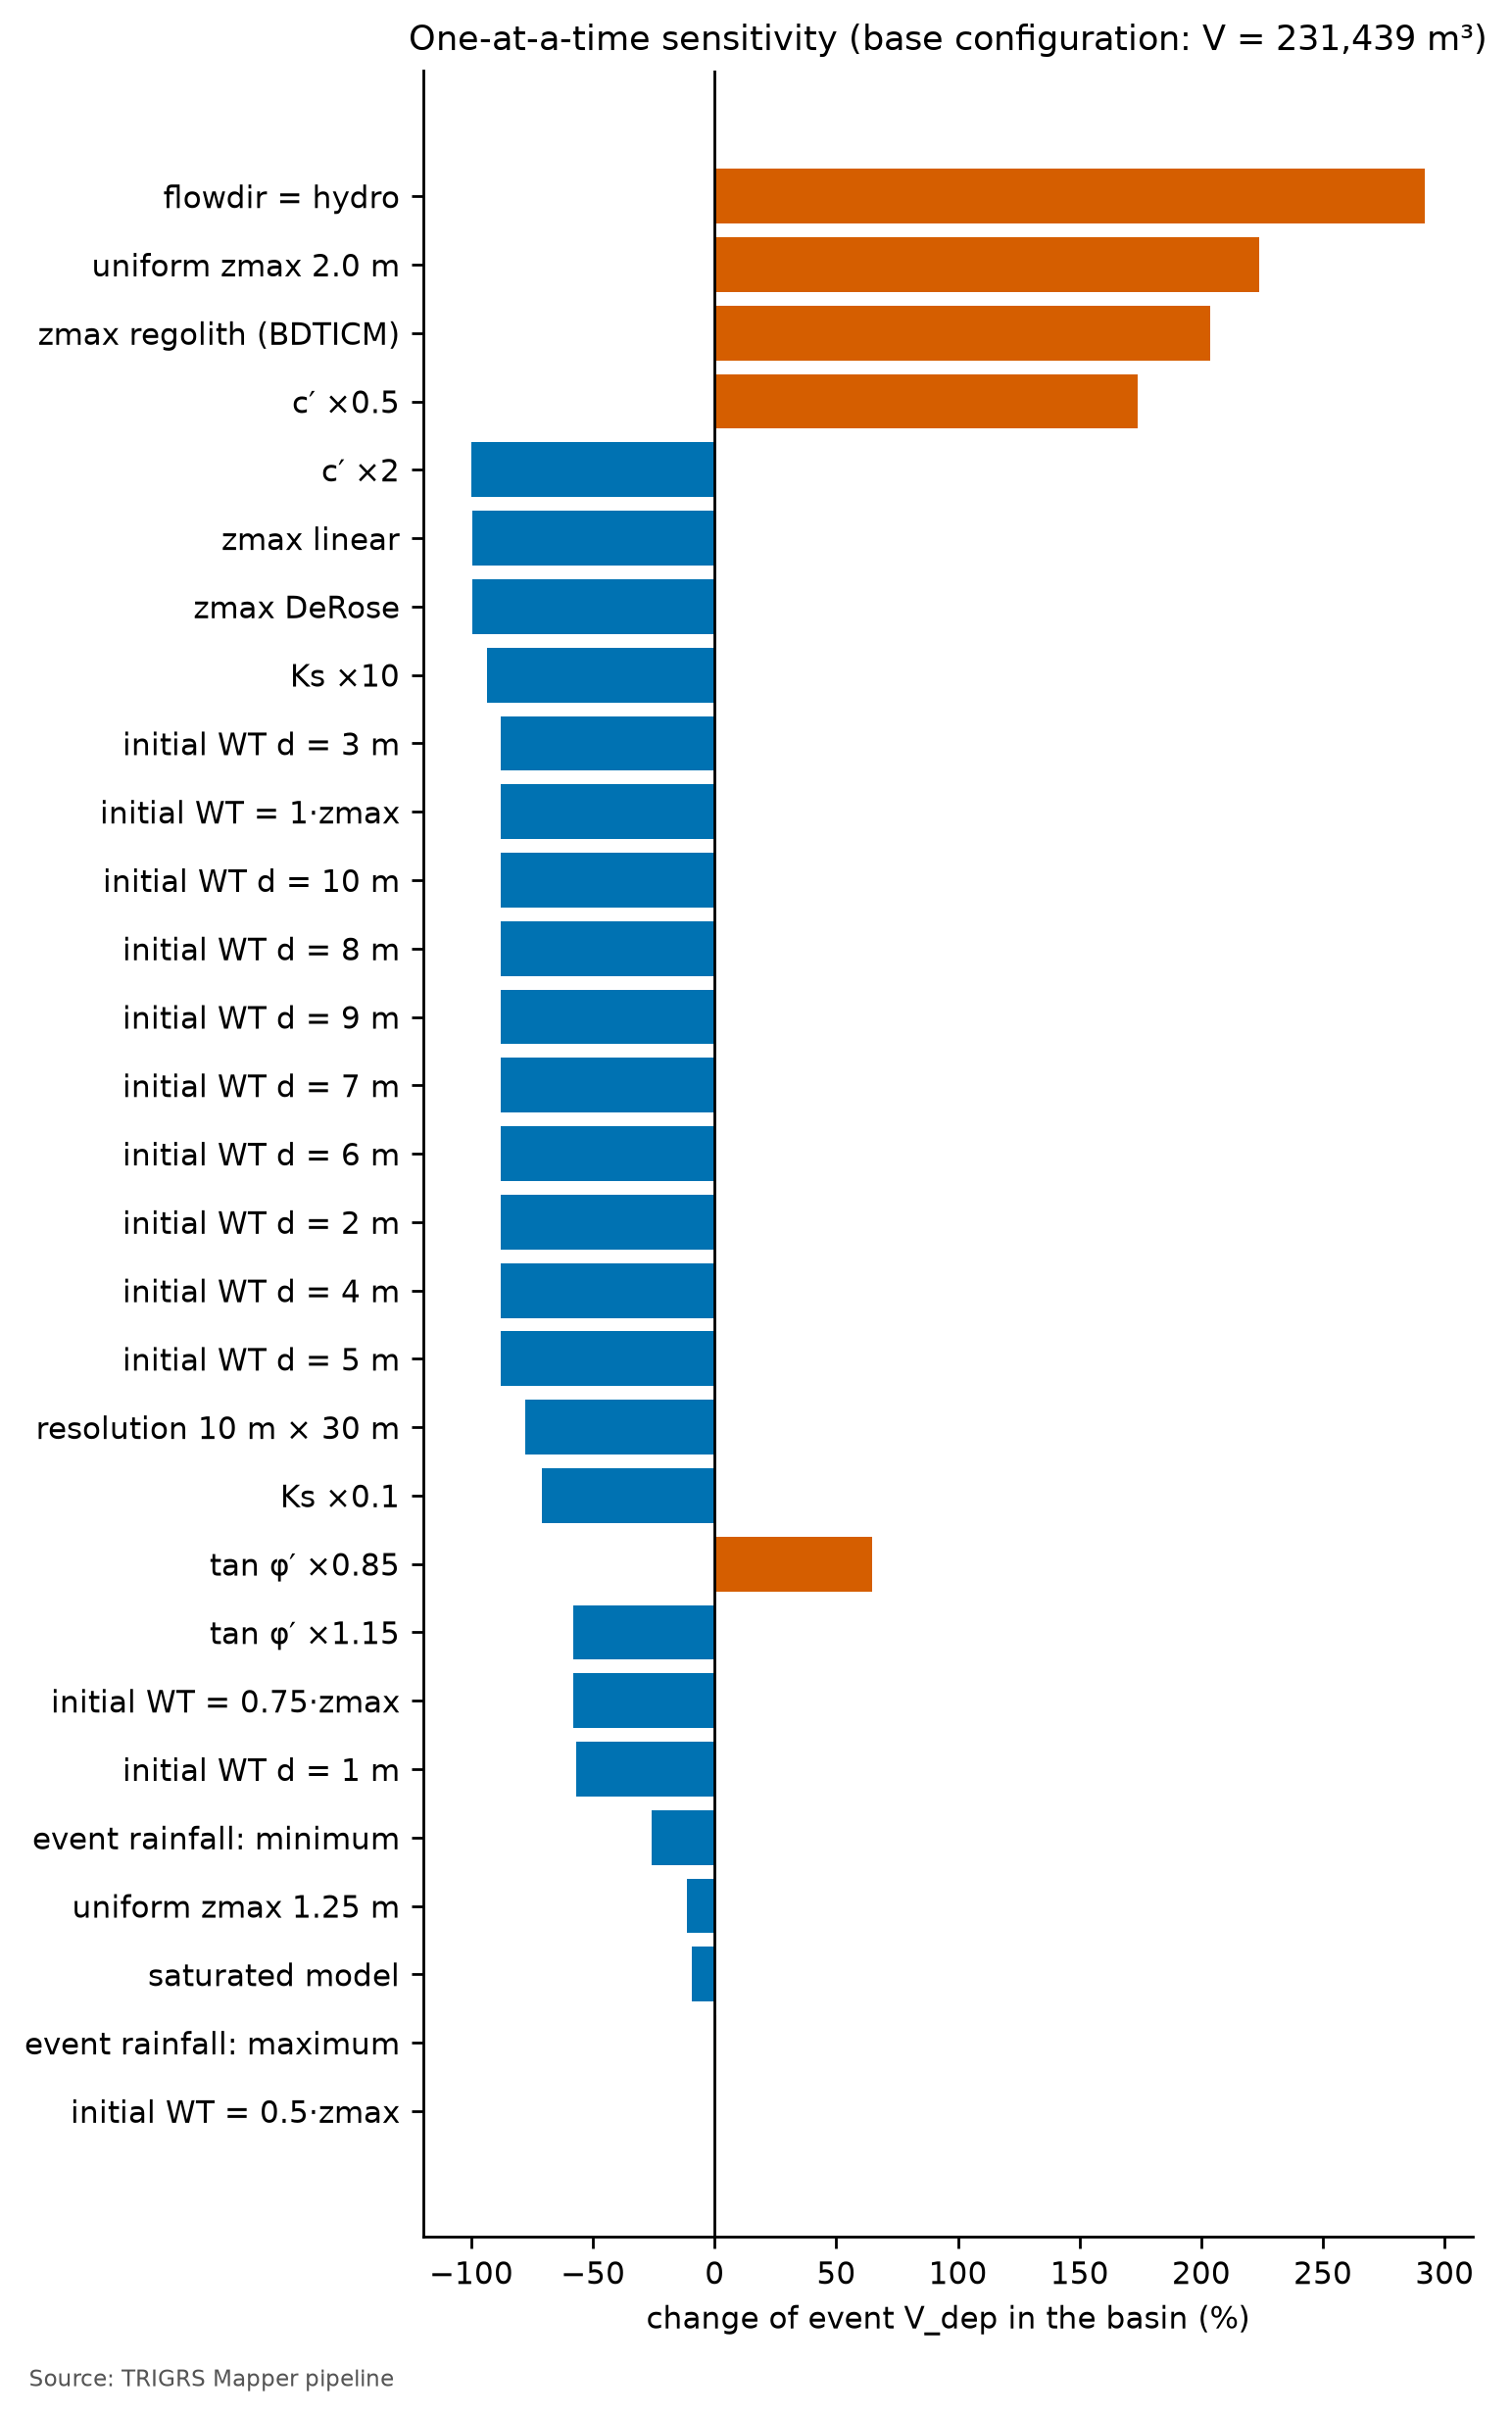
The factor with the largest effect on volume is flowdir = hydro (+291.9%); on the MSR, flowdir = hydro (+0.131). In the base configuration, the triggered MSR is 0.56; the Δ triggered MSR column shows whether a variation changes the hits on scars triggered by the rain or only the instability inherited from the initial condition. The initial WT is the axis of D6: with d = 1 m the Vdep changes by −57.0%, the MSR by −0.027 and the triggered MSR by −0.019; with d = 10 m (WT at the base), −87.8%, −0.041 and −0.033. Since depthwt = min(d, zmax) and zmax ≤ 5 m, the 5 and 10 m scenarios are identical — a simple check of the table. In the full run, all scenarios from 2 to 10 m coincide with the WT at the base (1·zmax): with the calibrated thickness, where the soil exceeds 2 m the slope is too gentle to fail. Without the calibrated initial WT (fNA = 0.50), the configuration loses almost all its instability (with the WT at the base, the Vdep changes by −87.8% and the triggered MSR drops back close to that of the a priori run), which shows the weight of the effective initial condition in the result.
The minimum and maximum scenarios of the event rainfall test the largest uncertainty of the forcing: with the maximum, the MSR changes by +0.001 and the triggered MSR by +0.001; with the minimum, by −0.010 and −0.010. If switching the scenario barely changes the total MSR but changes the triggered one, the total MSR was being dictated by the initial condition, and not by the January 12 rainfall — the symptom that led to D21 (Section 7.9.4).
That is not what happens here: the total and the triggered MSR change together, because the chosen configuration has almost no unstable cells before the event — the MSR responds to the January 12 rainfall, not to the initial condition. The response is small and asymmetric. With the maximum scenario, the Vdep changes by only +0.6%; with the minimum, by −26.0%. With the central rainfall, the susceptible hillslopes have already failed — the same saturation that flattens the design curves (Section 7.10.4) — and more rain hardly adds unstable cells; less rain removes part of them. For the calibration, the uncertainty of the event rainfall weighs in one direction only: a wetter scenario would hardly change the fit, but a drier one would call for weaker parameters.
Resolution matters in two ways. In the watershed, the Vdep of all unstable cells goes from 231,439 m³ at 30 m to 51,143 m³ at 10 m (−77.9%; in situ: 267,045 → 59,029 m³, −77.9%), and the unstable fraction from 6.5% to 1.4%. More important for Vdy12*, the share connected to the drainage (patch ÷ all) is 96.3% at 30 m and 52.1% at 10 m (patch Vdep: 222,779 and 26,630 m³; −88.0%). Connectivity is a property of the grid: at 30 m the unstable cells tend to form continuous patches that touch the network, whereas at 10 m they fragment and the gentler valley floor separates them from the channel — in the Petrópolis test, the patch was ≈ 90% of all unstable cells at 30 m and ≈ 7% at 10 m (D19). In the window, the verification of the calibrated configuration at 10 m gives MSR = 0.54 (30 m: 0.56), triggered MSR = 0.54 (0.56) and AUC = 0.74 (0.76).
The verification confirms the D12 30 m → 10 m transfer as far as skill is concerned: the triggered MSR drops slightly and remains above that of the a priori run (0.53). The unstable area does not: at 10 m, the unstable fraction of the window goes from 4.7% to 2.6%, and the event volume in the watershed at 30 m is several times that at 10 m. The design volumes (Section 7.10.4) are computed at 10 m, and the thresholds (Section 7.10.6) at 30 m.
Ranked by their effect on volume (Figure 7.32), the three largest factors are flowdir = hydro (+291.9%), the uniform 2 m thickness (+223.8%) and the regolito thickness model (+203.6%); close behind come cohesion (c′ × 0.5: +173.8%; c′ × 2: −100.0%), the linear and DeRose thickness models, which nearly zero the volume, and Ks × 10. The event volume depends, above all, on what was not measured in the watershed: the soil thickness and the drainage at the base. This makes sense: failure occurs at the base of the soil in all unstable cells (Zcr = zmax in 100.0% of them in the window; Section 7.10.3), and the volume of each is the cell area times the thickness given by the zmax model. Both Ks variations reduce the volume (× 0.1: −70.8%; × 10: −93.5%): the pore-pressure response to this rainfall peaks at an intermediate Ks, and the calibrated one is of the same order as the event’s peak intensity in 2-h blocks (24.3 mm/h; 10−5 m/s equals 36 mm/h).
The Δ triggered MSR column separates the variations that improve the hits on triggering from those that only “hit” more by destabilizing hillslopes before the rain. The uniform 2 m thickness raises the total MSR by +0.114, but the triggered one by only +0.013; the regolito model improves the total MSR (+0.078) and worsens the triggered one (−0.019). Those that raise the triggered MSR the most — flowdir = hydro (+0.094) and c′ × 0.5 (+0.081) — would not pass the D21 filters: they leave more than 1% of the window and more than 5% of the source cells unstable before the event (calibracao/sensibilidade.json), with several times the base volume.
7.10 From TRIGRS to Vdy12
For each unstable cell, TRIGRS delivers the thickness that would fail (Zcr). Summing these prisms gives a physically based hillslope volume — exactly the role of Vdy12 in the GIDES manual, whose method “a” estimates the volume of hillslope failures from maps or models (Section 7.7). Before the sum, three questions need an answer: on what basis to count the volume (in situ, deposited or bulked), which cells count (all unstable ones or only those that reach the drainage) and which instability counts (the one triggered by the rain or also the one that already existed at t = 0).
7.10.1 Three forms of the volume: in situ, deposited and bulked
- Vinsitu is the intact soil that fails, with its pores (θs ≈ porosity of the zone). It is directly comparable to the manual’s Bd·De·L, which measures the erodible thickness in situ and neglects bulking (GIDES manual, p. 34; NILIM TN 904).
- Vdep conserves the solids: the grain volume of the column, (1 − θs)·Vinsitu, redeposited with the deposit porosity λ = Kv = 0.4, the same as in Vdy2. It is the main form (D18): it puts the volume on the GIDES basis “with voids” without counting the pores twice. When θs ≈ λ, Vdep ≈ Vinsitu.
- Vsolto (bulked) is the convention of chapter 5: it treats the in situ column as if it were all grains and adds the voids of the deposit, i.e., +67% over the in situ value. It is kept as the upper bound. Chapter 5 remains valid as a demonstration of the procedure on a synthetic grid; in a real soil, with θs of 0.38 to 0.50, this calculation counts the pores twice.
A 10 m × 10 m cell (Apx = 100 m²) of mature residual soil (θs = 0.50, Table 7.30) fails with Zcr = 1.5 m:
- Vinsitu = 100 × 1.5 = 150 m³ — half of it is pore space: 75 m³ of grains and 75 m³ of voids;
- Vdep = 150 × (1 − 0.50)/(1 − 0.4) = 75/0.6 = 125 m³ — the 75 m³ of grains, redeposited with 40% voids;
- Vsolto = 150/(1 − 0.4) = 250 m³ — as if the 150 m³ were all grains.
In the colluvium (θs = 0.48), the same cell would give Vdep = 130 m³; in a talus deposit (θs = 0.38), 155 m³ — slightly more than in situ, because the source material was more compact than the new deposit. Between the forms, the difference is tens of percent; the choice of connectivity, below, and the grid resolution change the volume several times over (Section 7.9.7).
7.10.2 Connectivity with the drainage and initial condition
Not every unstable cell turns into a debris flow at the reference point: the manual defines Vdy1 as the volume that can be “converted into debris flow” (§2.5.1.1), i.e., the material that reaches the channel. TRIGRS does not model the travel of the mass; the pipeline uses three criteria of connectivity with the drainage network (A ≥ 1 ha), from the most to the least inclusive (D19, Table 7.42).
| Criterion | What enters | Role |
|---|---|---|
todas (all) |
all cells with FS < 1 in the watershed | upper bound (literal reading of method “a”) |
mancha (patch) |
patches of unstable cells (8-neighborhood) that touch the drainage network | main: basis of Vdy12* |
trajetoria (path) |
cells linked to the channel by a continuous D8 path of unstable cells | lower bound |
D21 adds the separation in time (Section 7.8.3). Each volume is computed in two versions: with the cells triggered by the rainfall only (FS0 ≥ 1 and minimum FS < 1; patches and paths formed by them alone) and with all unstable cells (the D19 total, which includes the cells already unstable at t = 0). Thus:
- Vdy12* = patch Vdep with the triggered cells only — the material that the rainfall mobilizes and that reaches the drainage;
- the D19 total (patch Vdep with all unstable cells) is kept as the conservative upper bound, reported next to the main value;
- the initial share, 1 − Vdy12* ÷ total, measures how much of the total comes from hillslopes already unstable without rain; the volume of the state at t = 0 (V0) does not depend on TR or climate. When the initial share exceeds 10% at TR 100 in the present, the upper bound should accompany the main value in the design volume.
For todas, the total is the sum of the triggered and the initial cells; for mancha and trajetoria, it is not: the cells with FS0 < 1 do not act as a bridge between the triggered cells and the drainage, and the total may exceed the sum of the two parts. Table 7.43 crosses the three forms with the three connectivities, for the triggered cells and for the total, in the 2011 event in the 10 m watershed.
| Form | Cells | Path (lower) | Patch (main) | All (upper) |
|---|---|---|---|---|
| Vinsitu (m³) | triggered | 25,607 |
31,087 |
59,550 |
| all unstable (D19) | 25,607 |
31,087 |
59,550 |
|
| Vdep (m³) | triggered | 22,193 |
26,931 | 51,583 |
| all unstable (D19) | 22,193 |
26,931 |
51,583 |
|
| Vsolto (m³) | triggered | 42,678 |
51,812 |
99,250 |
| all unstable (D19) | 42,678 |
51,812 |
99,250 |
In the event, Vdy12* is 26,931 m³ (Vdep of the patch connected to the drainage, with the rainfall-triggered cells only (D21)), and the D19 total is 26,931 m³: the initial share is 0.0%. With the configuration filtered by D21, no cell of the watershed is unstable in the initial condition (0 cells with FS0 < 1, 0.00% of the watershed, with the event land cover; V0 = 0 m³): the 445 unstable cells of the event were all triggered by the rainfall (445 triggered; 0.0% already unstable at t = 0), and the two rows of each form in Table 7.43 coincide — in Teresópolis, the event Vdy12* equals its upper bound. The connected patch accounts for 52.2% of the Vdep of all unstable cells; the rest lies in patches that do not touch the drainage and does not enter Vdy12*. By construction, path ≤ patch ≤ all, triggered ≤ total and Vdep < Vsolto; the pipeline’s physical check verifies this in every run (METODO-PIPELINE §10.1).
The event also allows an order-of-magnitude check. Vdy12 by method “a” in Section 7.7 (failure zones of the 2011 scars × a thickness of 1 to 2 m, Table 7.25) estimates what the hillslopes actually mobilized in 2011, in situ. The Vinsitu of the triggered cells — 31,087 m³ in the patch and 59,550 m³ in all of them — should have the same order of magnitude: several times larger indicates too many false alarms; much smaller, omissions.
This is what happens. The Vinsitu of all triggered cells lies within the range of method “a” with the failure zone taken as the upper third (1 to 2 m thick, shifted inventory) and slightly below its central value (1.5 m); the unstable area of the event in the watershed (4.45 ha) is practically that of the 2011 failure zones in this approximation, and the mean depth of the model’s failures (1.34 m) is close to the 1.5 m of the central scenario. The agreement is in quantity, not in location — in the window, the model hits only part of the source areas (triggered TPR = 0.16, Section 7.9.5) — but it shows that, in volume, the calibrated event neither inflates nor empties the hillslopes. The Vinsitu of the patch, which counts only what reaches the drainage, falls below the range of method “a”, which adds up all failure zones without asking whether the material reaches the channel.
7.10.3 Maps of critical depth and of volume per pixel
In the event, 445 cells of the watershed (4.45 ha; 1.4% of the area) become unstable, with a mean Zcr of 1.34 m. Figure 7.33 compares the distribution of Zcr with that of zmax in the same cells: Zcr close to zmax indicates failure at the soil–rock contact, on the impermeable base where pressure builds up — the mechanism described for the region — whereas Zcr well below zmax (shallower) indicates failure within the soil, at the wetting front. In the 2011 event, the two distributions coincide: Zcr = zmax in 100.0% of the unstable cells of the watershed (and in 100.0% in the calibration window) — all of them fail at the base of the soil, nearly all within the 1–2.5 m band. The volume is therefore dictated by the calibrated thickness model (Equation 7.5), and the median Zcr used in the selection (Section 7.9.4) tests the coefficients of that model, not the hydrological response. Figure 7.34 shows the volume of each unstable cell (Apx·Zcr, in situ): the sum of this map is the Vinsitu of all cells, and only the triggered patches that touch the drainage enter Vdy12*.
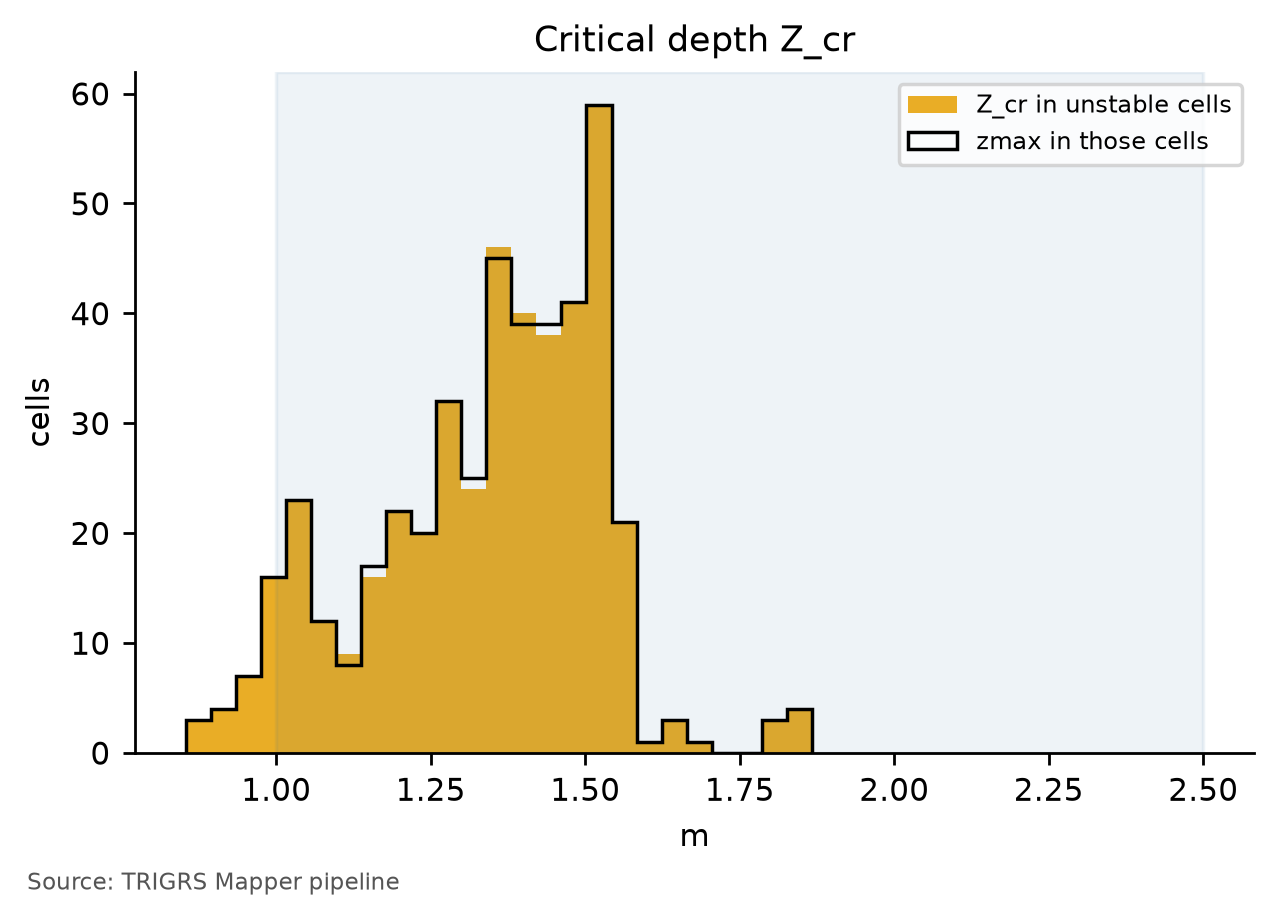
zmax of those same cells; shaded band: 1–2.5 m, depth of the shallow failures observed in the region.
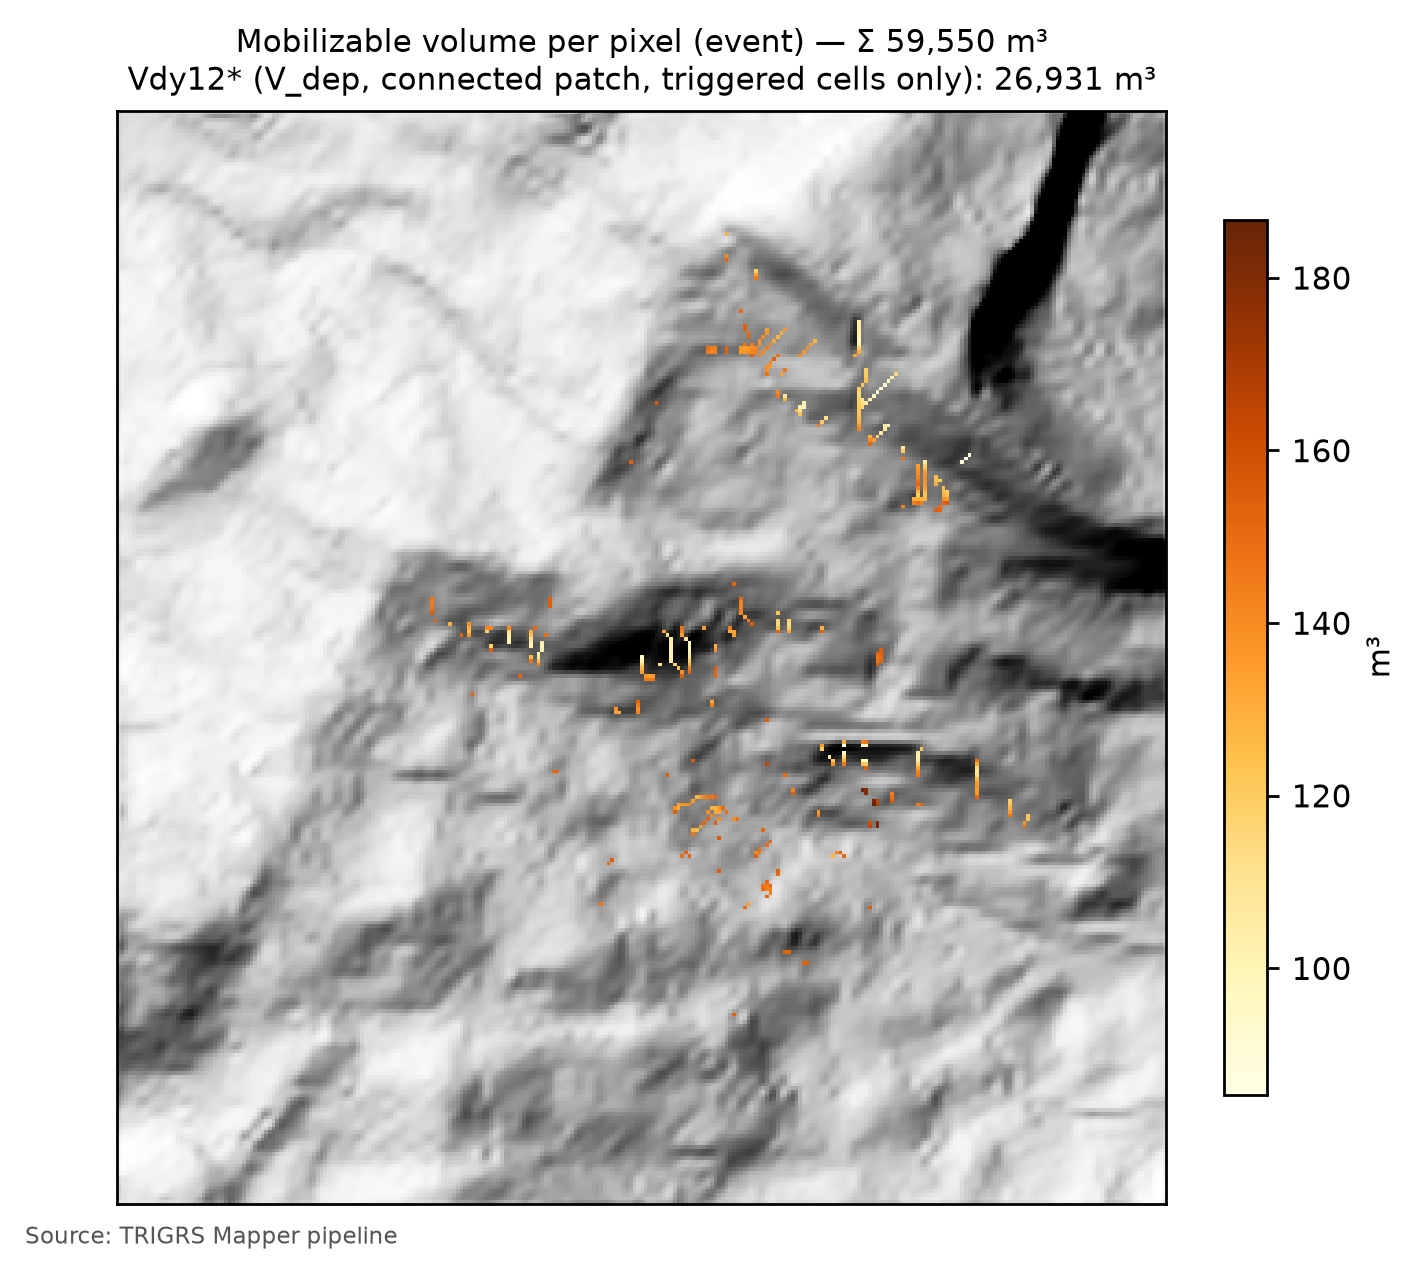
7.10.4 Volume × return period, in the present and in the future
The design runs apply the 24-h hyetographs of Section 7.5.5 to the 10 m watershed, followed by 24 h without rain to capture the delayed response, with the MapBiomas 2025 land cover and the calibrated configuration — including the effective initial WT of the calibration, the same in the present and in the future. The full run covers TR from 2 to 500 years in the present and in 10 future scenarios: SSP2-4.5 and SSP5-8.5 in 2041–2070 (P50) and in 2071–2100 (P10, P50 and P90), and SSP1-2.6 and SSP3-7.0 in 2071–2100 (P50) (D20; factors in Section 7.6). Runs available: 88 (TR: 2, 5, 10, 25, 50, 100, 200, 500; scenarios: present; SSP1-2.6 2071–2100 P50; SSP2-4.5 2041–2070 P50; SSP2-4.5 2071–2100 P50; SSP2-4.5 2071–2100 P10; SSP2-4.5 2071–2100 P90; SSP3-7.0 2071–2100 P50; SSP5-8.5 2041–2070 P50; SSP5-8.5 2071–2100 P50; SSP5-8.5 2071–2100 P10; SSP5-8.5 2071–2100 P90).
| Scenario / RP (yr) | 2 | 5 | 10 | 25 | 50 | 100 | 200 | 500 |
|---|---|---|---|---|---|---|---|---|
| present — path, triggered cells only (lower bound) | 7,210 | 8,494 | 9,689 | 11,910 | 15,222 | 21,083 | 21,083 | 21,083 |
| present — Vdy12* (patch, triggered cells only) | 7,481 | 8,880 | 10,784 | 14,322 | 18,655 | 25,546 | 25,546 | 25,546 |
| present — patch including cells unstable at t = 0 (D19 total; upper bound) | 7,481 | 8,880 | 10,784 | 14,322 | 18,655 | 25,546 | 25,546 | 25,546 |
| present — initial share (patch of the cells with FS0 < 1) | 0 | 0 | 0 | 0 | 0 | 0 | 0 | 0 |
| present — all unstable cells (literal reading of method a) | 17,168 | 22,527 | 25,995 | 31,661 | 39,837 | 49,789 | 49,789 | 49,789 |
| SSP1-2.6 2071–2100 P50 | 7,710 | 10,068 | 12,377 | 18,135 | 25,546 | 25,546 | 25,546 | 25,546 |
| SSP2-4.5 2041–2070 P50 | 7,825 | 10,068 | 12,501 | 18,524 | 25,546 | 25,546 | 25,546 | 25,546 |
| SSP2-4.5 2071–2100 P50 | 8,057 | 11,027 | 14,322 | 23,805 | 25,546 | 25,546 | 25,546 | 25,546 |
| SSP2-4.5 2071–2100 P10 | 7,481 | 8,762 | 10,307 | 12,749 | 17,358 | 25,546 | 25,546 | 25,546 |
| SSP2-4.5 2071–2100 P90 | 8,644 | 12,377 | 18,394 | 25,546 | 25,546 | 25,546 | 25,546 | 25,546 |
| SSP3-7.0 2071–2100 P50 | 8,057 | 10,784 | 12,997 | 23,805 | 25,546 | 25,546 | 25,546 | 25,546 |
| SSP5-8.5 2041–2070 P50 | 7,825 | 10,784 | 12,873 | 22,081 | 25,546 | 25,546 | 25,546 | 25,546 |
| SSP5-8.5 2071–2100 P50 | 8,173 | 11,271 | 14,822 | 25,546 | 25,546 | 25,546 | 25,546 | 25,546 |
| SSP5-8.5 2071–2100 P10 | 7,481 | 8,880 | 11,393 | 15,699 | 23,405 | 25,546 | 25,546 | 25,546 |
| SSP5-8.5 2071–2100 P90 | 8,880 | 13,122 | 23,139 | 25,546 | 25,546 | 25,546 | 25,546 | 25,546 |
At TR 100, the 24-h rainfall of 216.6 mm leaves 1.4% of the watershed unstable (1.4% triggered by the rainfall) and gives Vdy12* = 25,546 m³ (Vdep of the patch connected to the drainage, with the rainfall-triggered cells only (D21)), from 21,083 m³ in the path to 49,789 m³ in all triggered cells; the upper bound, the D19 total, is 25,546 m³ (initial share: 0.0%). By the end of the century, with 259.0 mm (SSP2-4.5) and 270.4 mm (SSP5-8.5), Vdy12* changes by 0.0% and 0.0% (the upper bound by 0.0% and 0.0%); Vdy2 grows by +19.5% and +24.8%, in proportion to the daily rainfall (Table 7.27). Figure 7.35 plots the volume × TR curves with the spread among models, and Figure 7.36 compares the FS maps of TR 100 in the present and at the end of the century.
The curves call for two reading cautions. First, the TRIGRS volume is not linear in rainfall like Vdy2: it grows only when the extra rainfall brings new cells to FS < 1 or deepens Zcr, and it flattens out when the susceptible hillslopes have already failed — a flat curve indicates a watershed limited by the susceptibility of its hillslopes, not by rainfall. Second, the initial condition: the cells already unstable without rain would form a volume that does not depend on TR or climate and that, if it entered Vdy12*, would flatten the curves and dilute the effect of rainfall; it is therefore kept only in the upper bound.
In Teresópolis, the curves of the full run (Table 7.44 and Figure 7.35) have two parts. Up to TR 50 in the present, Vdy12* grows with rainfall, from 7,481 m³ at TR 2 to 18,655 m³ at TR 50. From TR 100 on, the curve is flat: Vdy12* stops at 25,546 m³, with 1.4% of the watershed unstable, up to TR 500, and no climate scenario exceeds this plateau. This is the expected behavior when the rainfall already saturates the soil of the susceptible hillslopes: from then on, pore pressure no longer rises (in TRIGRS, it is capped at that of a water table at the ground surface) and the excess rainfall becomes runoff. The plateau is practically the Vdy12* of the 2011 event itself (26,931 m³, Section 7.10.2): with the calibrated parameters, the central 2011 rainfall already brought the watershed close to the limit of the hillslopes that can fail.
The effect of climate on Vdy12* therefore depends on TR. Where the curve still rises, it is large: at TR 10, under SSP5-8.5 in 2071–2100, Vdy12* changes by +37.4% at P50 (from +5.6% at P10 to +114.6% at P90) and, at TR 25, by +78.4% at P50. From TR 100 on, the effect is nil in all scenarios — at TR 100 under SSP5-8.5 (P50), 0.0%, against +24.8% in Vdy2. The P10–P90 spread is wide at the low TRs and closes at the plateau, and the upper bound changes exactly like the main value. At the design TR, therefore, climate change enters the volume through transport (Vdy2), not through the availability of material on the hillslopes (Section 7.10.5).
The D21 initial-condition flags are all off. With the design land cover, 0.00% of the watershed has FS0 < 1 (0 cells, of which 0 are unstable even without pore pressure; V0 = 0 m³ in the patch); with the event land cover, 0.00% (above 1%, a sign of inconsistency with the calibration: no); and there is no land-use effect — FS0 < 1 larger with the design land cover than with the event one: no. At TR 100 in the present, the initial share is 0.0% (above 10%, the upper bound should accompany the main value: no). The main value and the upper bound coincide in every design run. projeto.json also records, in each run, the share already unstable at the first output (t ≈ 2 h): 0.0% of the unstable cells of TR 100 in the present.
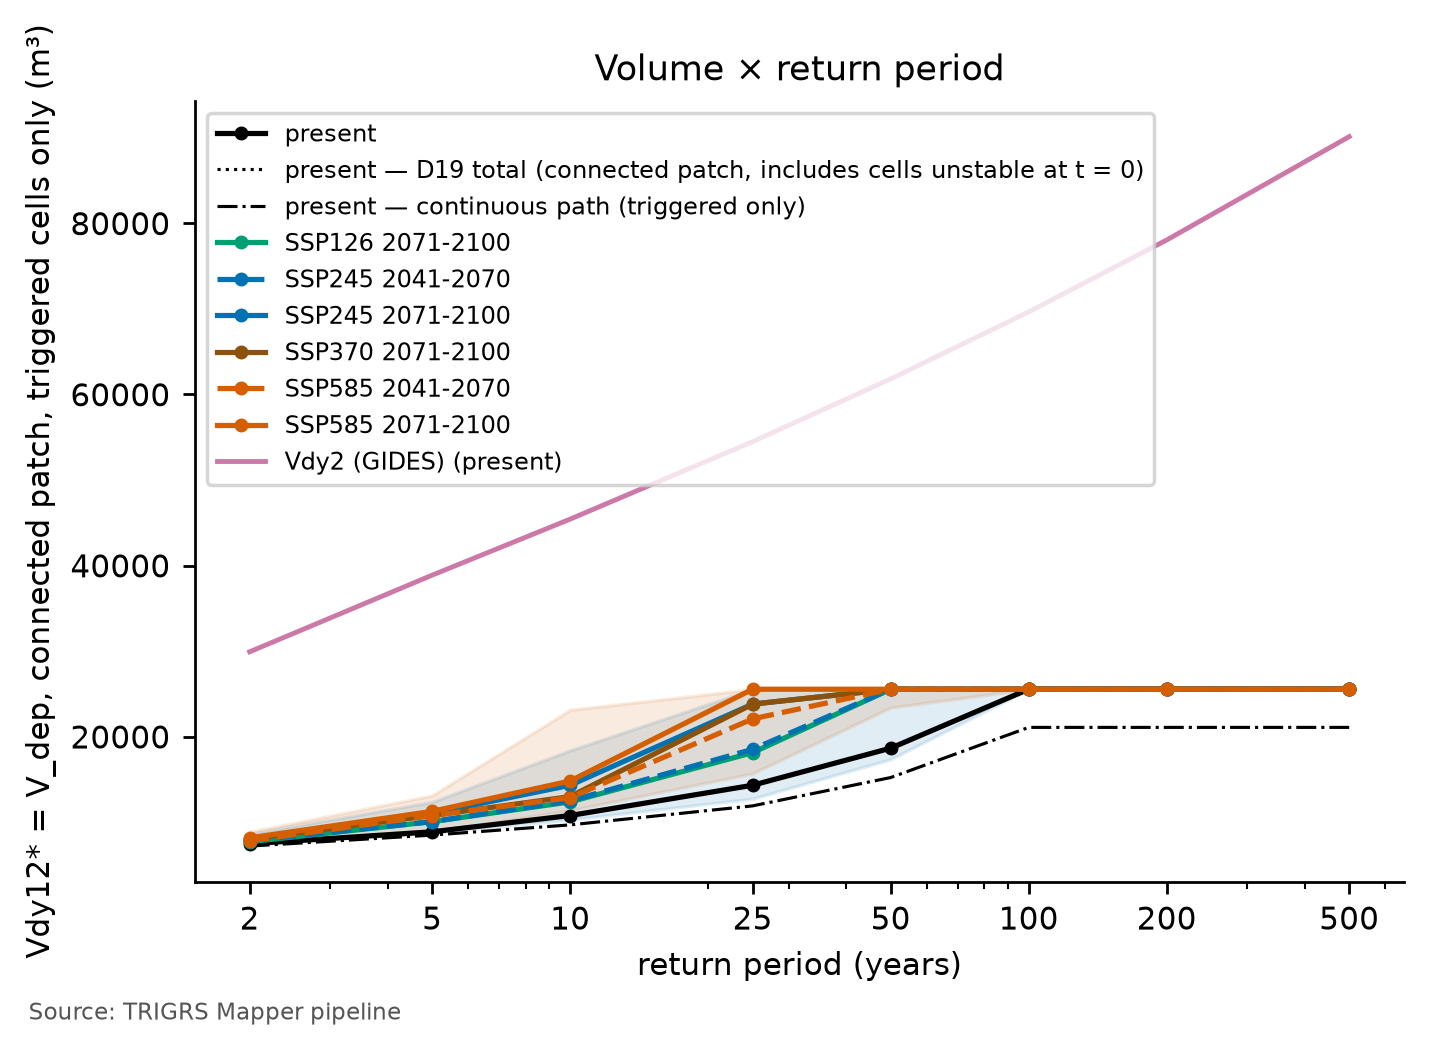
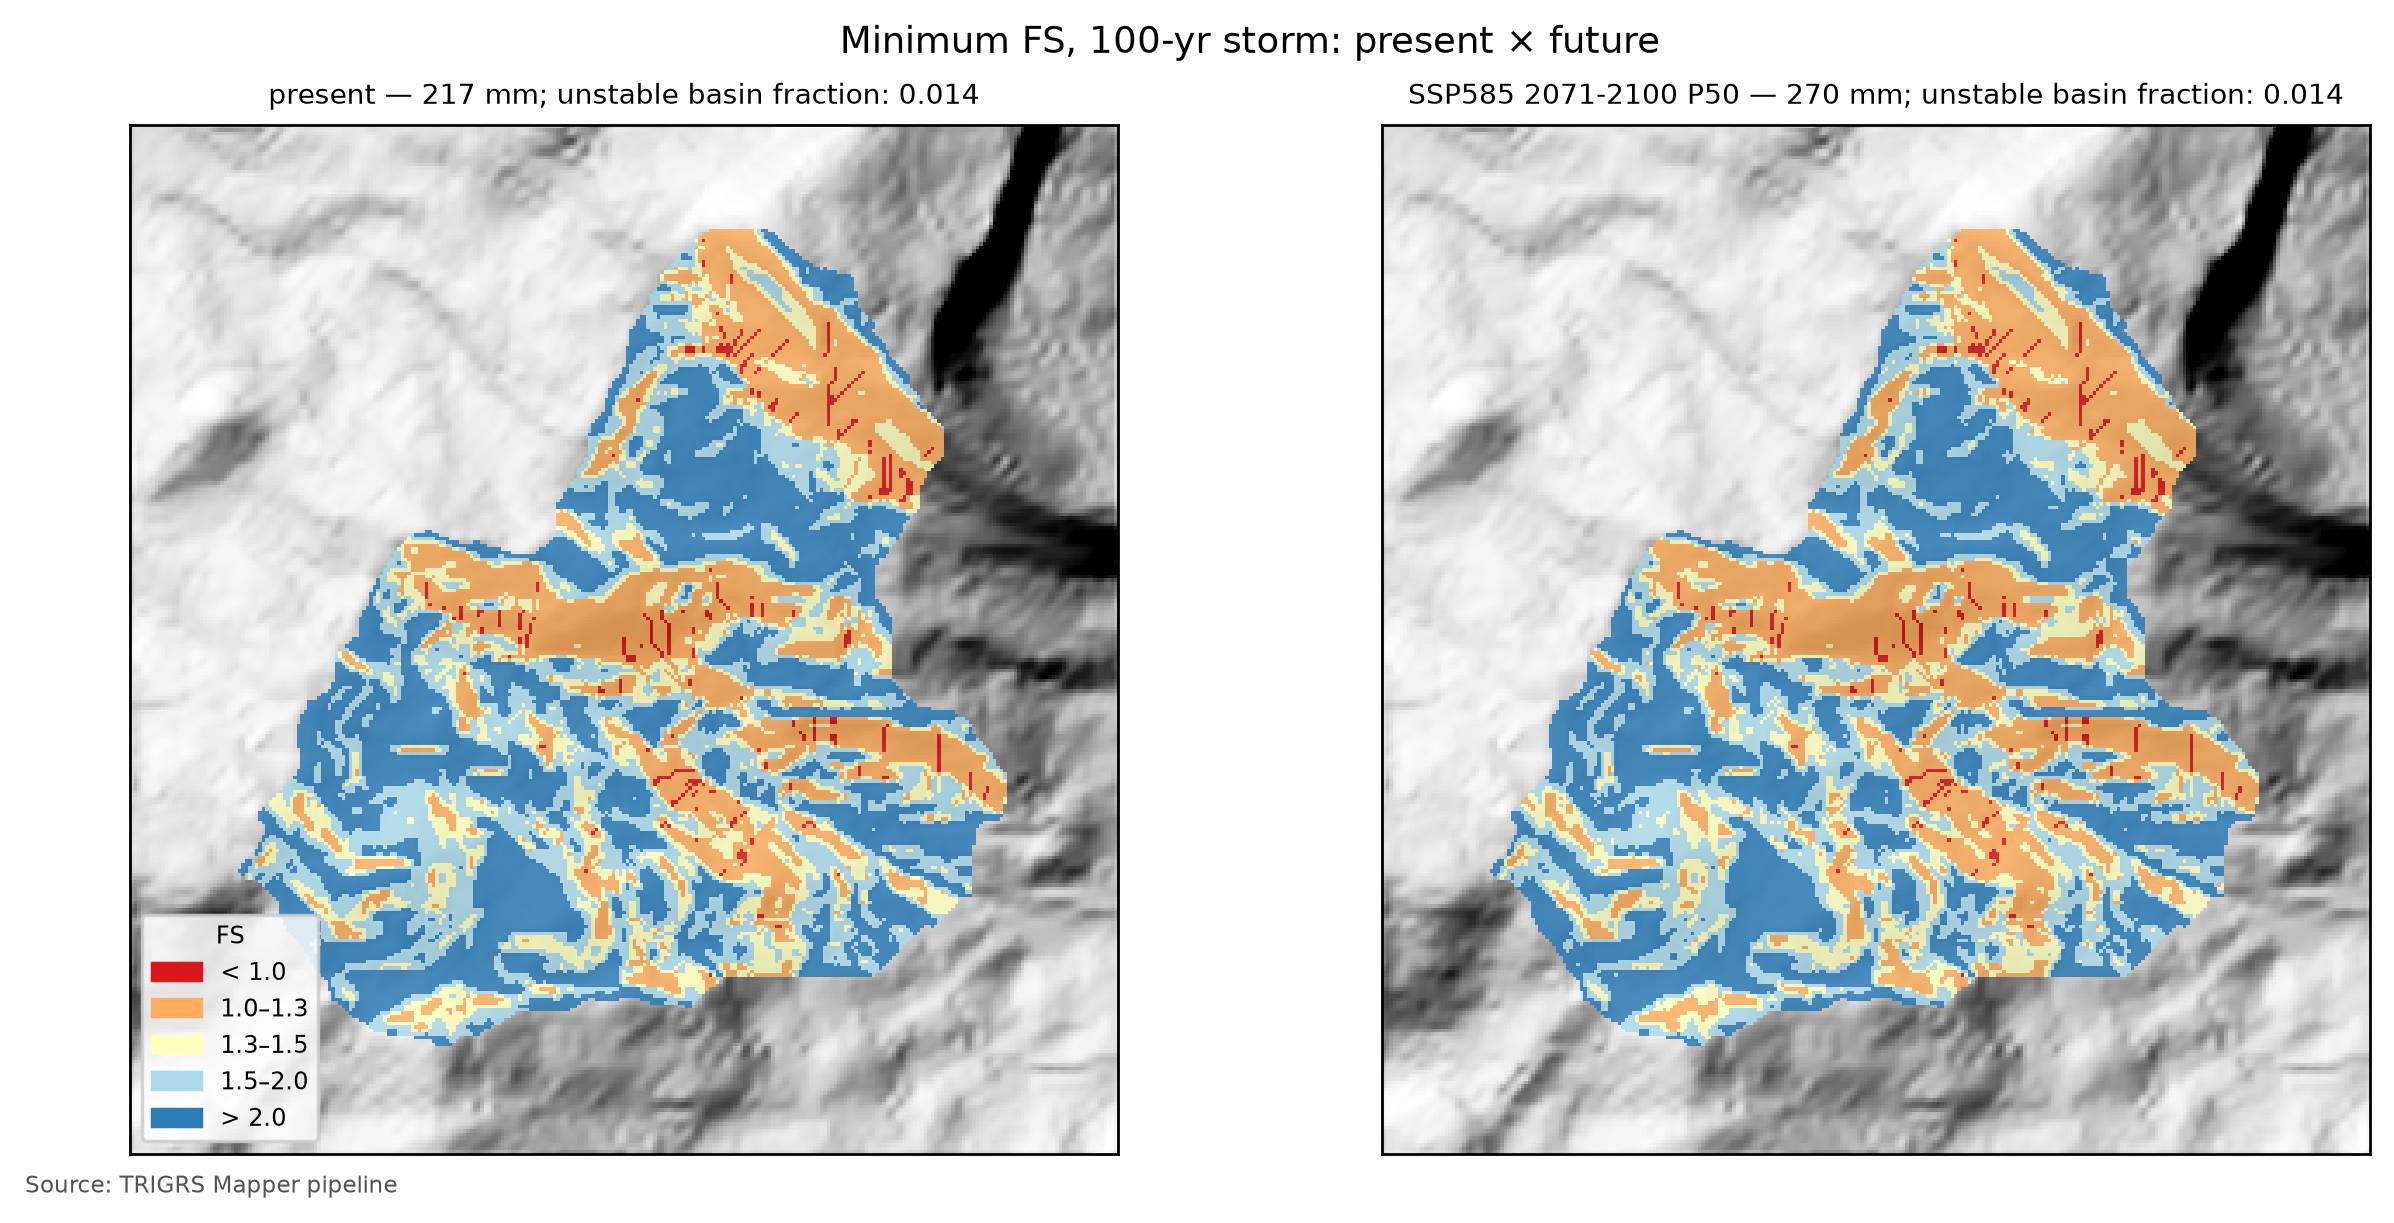
7.10.5 From Vdy12* to Vd*: which term governs?
The coupling replaces a single term of the manual’s accounting:
with Vdy11 = 135,567 m³ and Vw = 344 m³ from Section 7.7 (Vw = 0.9·Vwy, as in Table 7.26). Only Vdy12 changes: instead of Bd·De cross sections assumed for the zero-order thalwegs (Vdy12 by method b = 82,067 m³), what enters is the volume of the hillslopes that the design rainfall destabilizes and that reaches the drainage — the triggered cells only (D21), with the D19 total recomputed in parentheses in Table 7.45.
| Scenario | RP (yr) | Vdy12* (upper bound) (m³) | Initial share (%) | Vdy1* (m³) | Vdy2 (m³) | Vd* (upper bound) (m³) | Governs | Trad. Vd (governs) (m³) |
|---|---|---|---|---|---|---|---|---|
| present | 100 | 25,546 (25,546) | 0.0 | 161,112 | 69,646 | 69,646 (69,646) | Vdy2 | 69,646 (Vdy2) |
| present | 200 | 25,546 (25,546) | 0.0 | 161,112 | 78,049 | 78,049 (78,049) | Vdy2 | 78,049 (Vdy2) |
| SSP2-4.5 2071–2100 P50 | 100 | 25,546 (25,546) | 0.0 | 161,112 | 83,255 | 83,255 (83,255) | Vdy2 | 83,255 (Vdy2) |
| SSP2-4.5 2071–2100 P50 | 200 | 25,546 (25,546) | 0.0 | 161,112 | 93,408 | 93,408 (93,408) | Vdy2 | 93,408 (Vdy2) |
| SSP5-8.5 2071–2100 P50 | 100 | 25,546 (25,546) | 0.0 | 161,112 | 86,917 | 86,917 (86,917) | Vdy2 | 86,917 (Vdy2) |
| SSP5-8.5 2071–2100 P50 | 200 | 25,546 (25,546) | 0.0 | 161,112 | 97,158 | 97,158 (97,158) | Vdy2 | 97,158 (Vdy2) |
The minimum rule has a physical reading (chapter 1):
- Vdy2 < Vdy1* — the watershed has more sediment available than the rainfall can carry: the volume is transport-limited and grows with rainfall (and with climate change) in proportion to Vdy2;
- Vdy1* < Vdy2 — the rainfall could carry more than there is: the volume is supply-limited, and what decides is how much the hillslopes and the bed supply — this is where the TRIGRS Vdy12* matters.
At TR 100 in the present, the term that governs Vd* is Vdy2 (rainfall transport capacity (Vdy2)), with Vd* = 69,646 m³ (design volume with woody debris: 69,990 m³), against a traditional Vd of 69,646 m³, governed by Vdy2. With the upper bound of Vdy12* instead of the main value, Vd* would be 69,646 m³, governed by Vdy2. In the full run, the result is the same in the 88 design runs (8 TR × 11 scenarios): Vdy2 governs Vd* in all of them, also with the upper bound of Vdy12*, and Vd* equals the traditional Vd. Vdy12* never comes close to Vdy2 — even at the plateau, it stays below the TR 2 Vdy2 — and Vdy1* (161,112 m³ from TR 100 on) stays well below the traditional Vdy1 (217,633 m³), because the volume of the connected hillslopes that the design rainfall destabilizes is much smaller than Vdy12 by method b.
Vdy11 alone (135,567 m³) exceeds the Vdy2 of every TR and scenario in Table 7.45 — the largest is that of TR 200 under SSP5-8.5 in 2071–2100 (P50), 97,158 m³. Since Vdy12* ≥ 0, Vdy1* ≥ Vdy11 > Vdy2: whatever the TRIGRS result, the Vd* of these scenarios is transport-limited and equals the traditional Vd, and it grows with climate in proportion to Vdy2 (+24.8% at TR 100 under SSP5-8.5). For the same reason, separating the initial condition (D21) does not change the Vd* of these scenarios: the main value and the upper bound give the same design volume. Two caveats may change the regime: (i) Vdy11 depends on the erodible cross-section assumptions and, above all, on the channel-initiation threshold — with 3 to 5 ha it falls below the TR 100 Vdy2 (Table 7.24), and it is then Vdy12* that decides whether Vdy1* stays above Vdy2; (ii) at the highest TRs under the P90 scenarios, Vdy2 approaches Vdy11 — at TR 500 under SSP5-8.5 in 2071–2100 (P90) it slightly exceeds it (tables in gides/), and it is Vdy12* that keeps Vdy1* above it: with the plateau of the full run, the Vd* of that scenario is still governed by Vdy2 (136,829 m³, equal to the traditional Vd, 136,829 m³). In Teresópolis, therefore, the value of TRIGRS lies less in the number of the design volume and more in where the connected material is, when it fails and with what rainfall — the basis of the thresholds below.
7.10.6 Rainfall thresholds and the Forecast tab
The same calibrated model, run with uniform rainfalls of increasing totals for each duration (1, 3, 6, 12, 24, 48 and 72 h) and for four initial WT conditions (d = 1, 2 and 5 m and the base condition), gives the watershed’s physically based rainfall thresholds: the total that brings 1% and 5% of the watershed to FS < 1 and the total that makes Vdy12* equal the TR 100 Vdy2, interpolated on a logarithmic scale between the totals run, with the minimum FS up to 24 h after the rainfall (pipeline/limiares.py). Since D21, the 1% and 5% thresholds count only the cells triggered by the rainfall: those that already have FS0 < 1 without rain cannot “reach” a rainfall threshold — the same idea as the critical area ratio of the physically based thresholds of Marin and coworkers, which excludes the cells unstable without rain (Zhang et al., 2022). Fraction used: triggered fraction of the watershed (FS0 ≥ 1 at t = 0 and FS < 1, D21); volume criterion: Vdep of the patch connected to the drainage, with the rainfall-triggered cells only (D21). In Teresópolis, for cost reasons, the thresholds use the watershed at 30 m (D20).
| Initial water table | Duration (h) | 1% of the watershed — triggered (mm) | 5% of the watershed — triggered (mm) | Vdy12* ≥ Vdy2 (mm) | 1% — total fraction (mm) | 5% — total fraction (mm) |
|---|---|---|---|---|---|---|
| base (0.50·zmax) — FS0 < 1: 0.00% | 1 | > 540 | > 540 | > 540 | > 540 | > 540 |
| base (0.50·zmax) — FS0 < 1: 0.00% | 3 | 30 | > 540 | 69 | 30 | > 540 |
| base (0.50·zmax) — FS0 < 1: 0.00% | 6 | 31 | 130 | 68 | 31 | 130 |
| base (0.50·zmax) — FS0 < 1: 0.00% | 12 | 41 | 131 | 70 | 41 | 131 |
| base (0.50·zmax) — FS0 < 1: 0.00% | 24 | 50 | 134 | 87 | 50 | 134 |
| base (0.50·zmax) — FS0 < 1: 0.00% | 48 | 87 | 139 | 105 | 87 | 139 |
| base (0.50·zmax) — FS0 < 1: 0.00% | 72 | 97 | 171 | 128 | 97 | 171 |
| d = 1 m — FS0 < 1: 0.00% | 1 | > 540 | > 540 | > 540 | > 540 | > 540 |
| d = 1 m — FS0 < 1: 0.00% | 3 | > 540 | > 540 | > 540 | > 540 | > 540 |
| d = 1 m — FS0 < 1: 0.00% | 6 | 137 | > 540 | > 540 | 137 | > 540 |
| d = 1 m — FS0 < 1: 0.00% | 12 | 137 | 225 | 174 | 137 | 225 |
| d = 1 m — FS0 < 1: 0.00% | 24 | 149 | 228 | 182 | 149 | 228 |
| d = 1 m — FS0 < 1: 0.00% | 48 | 173 | 233 | 201 | 173 | 233 |
| d = 1 m — FS0 < 1: 0.00% | 72 | 208 | 245 | 217 | 208 | 245 |
| d = 2 m — FS0 < 1: 0.00% | 1 | > 540 | > 540 | > 540 | > 540 | > 540 |
| d = 2 m — FS0 < 1: 0.00% | 3 | > 540 | > 540 | > 540 | > 540 | > 540 |
| d = 2 m — FS0 < 1: 0.00% | 6 | > 540 | > 540 | > 540 | > 540 | > 540 |
| d = 2 m — FS0 < 1: 0.00% | 12 | 167 | > 540 | 289 | 167 | > 540 |
| d = 2 m — FS0 < 1: 0.00% | 24 | 181 | 381 | 286 | 181 | 381 |
| d = 2 m — FS0 < 1: 0.00% | 48 | 204 | 396 | 297 | 204 | 396 |
| d = 2 m — FS0 < 1: 0.00% | 72 | 234 | 432 | 329 | 234 | 432 |
| d = 5 m — FS0 < 1: 0.00% | 1 | > 540 | > 540 | > 540 | > 540 | > 540 |
| d = 5 m — FS0 < 1: 0.00% | 3 | > 540 | > 540 | > 540 | > 540 | > 540 |
| d = 5 m — FS0 < 1: 0.00% | 6 | > 540 | > 540 | > 540 | > 540 | > 540 |
| d = 5 m — FS0 < 1: 0.00% | 12 | 167 | > 540 | 289 | 167 | > 540 |
| d = 5 m — FS0 < 1: 0.00% | 24 | 181 | 381 | 286 | 181 | 381 |
| d = 5 m — FS0 < 1: 0.00% | 48 | 204 | 396 | 297 | 204 | 396 |
| d = 5 m — FS0 < 1: 0.00% | 72 | 234 | 432 | 329 | 234 | 432 |
With the WT of the base condition (0.50·zmax), 50 mm in 24 h bring 1% of the watershed to FS < 1 through triggered cells, 134 mm bring 5%, and 87 mm make Vdy12* reach the TR 100 Vdy2 (69,646 m³). In 6 h, the thresholds are 31, 130 and 68 mm; in 72 h, 97, 171 and 128 mm. With the initial WT at 1 m, the 1% threshold in 24 h is 149 mm. In this base condition, 0.00% of the watershed already has FS0 < 1 (WT at 1 m: 0.00%); counting these cells as well (total fraction), the 24-h thresholds would be 50 and 134 mm. The prefix “≤” indicates a threshold already reached at the smallest total evaluated (the value is an upper bound) and “>”, a threshold not reached up to 540 mm. To put the numbers in context, compare them with the 24-h design rainfall (Table 7.14) and with the 2011 rainfall (Table 7.1).
Read against the P24h of Table 7.14, the 24-h thresholds depend above all on the initial WT. With the WT of the base condition — the wet state calibrated for January 2011 — 1% of the watershed becomes unstable with less rainfall than that of TR 2 (93.1 mm), the volume criterion is reached slightly below it, and 5% requires a rainfall between those of TR 5 and TR 10 (120.9 and 141.3 mm). With the WT at 1 m, the thresholds rise to between the rainfalls of TR 10 and 25 (1%), of TR 25 and 50 (volume) and of TR 100 and 200 (5%). With the WT at 2 m or deeper — which, with the calibrated thickness, is equivalent to the WT at the base — 1% requires a rainfall between those of TR 25 and 50, and 5% and the volume criterion exceed the present-day TR 500 rainfall (280.3 mm). The rainfall of January 12, 2011 (Table 7.20) exceeds the three thresholds of the base condition in the central and maximum scenarios; in the minimum one, it exceeds those of 1% and of volume. In 1 h, no total up to 540 mm brings 1% of the watershed to FS < 1, under any WT condition: the infiltration in one hour is limited by Ks, and the rest runs off. In Teresópolis, no cell has FS0 < 1 in any of the four WT conditions, and the total fraction gives exactly the same thresholds as the triggered one — in Table 7.46, the last two columns repeat the 1% and 5% columns of the triggered fraction.
Two reading cautions. First, the thresholds were computed at 30 m (D20), where the unstable area and the connectivity are much larger than at 10 m (Section 7.9.7), and with uniform rainfall, which at long durations infiltrates entirely, whereas the peaks of the design hyetographs exceed Ks and partly run off. At 10 m, with the design hyetographs, 1% of the watershed becomes unstable only between TR 25 and 50 (0.9% and 1.2%), 5% is never reached and Vdy12* never reaches Vdy2 (Section 7.10.4): the 30 m thresholds are conservative, especially the volume one. Second, the WT of the base condition is the storm state, the upper bound of the initial moisture (Section 7.8.3): with it, the thresholds are the lowest, and the rows with a deeper WT show how much they rise with a less wet antecedent condition.
These thresholds feed the Forecast tab (Previsão) of the TRIGRS Mapper portal (planned domain trigrs.dpm-sedec-sas.tech, being deployed), which compares observed or forecast rainfall with the watershed threshold and also runs TRIGRS itself on demand, in three modes: scenario (the user sets the total, duration, antecedent rainfall, initial WT and multipliers), thresholds and experimental numerical forecast (Open-Meteo: ECMWF IFS, GFS and ICON, up to 72 h). The watershed alert class combines area and volume (Table 7.47) and, like the thresholds, counts only the cells triggered by the rainfall.
trigrs_mapper.forecast; D21: fraction and volume of the triggered cells, so that hillslopes already unstable without rain do not trigger the alert).
| Class | Criterion |
|---|---|
| green | less than 1% of the watershed with FS < 1 through cells triggered by the rainfall |
| yellow | 1% or more of the watershed with FS < 1 through triggered cells (FS0 ≥ 1) |
| orange | 5% or more of the watershed, likewise |
| red | Vdy12* (triggered cells only) ≥ Vdy2 (TR 100, present) |
The Forecast tab is a research prototype and does not replace the official warnings of Cemaden (Brazil’s National Center for Monitoring and Early Warning of Natural Disasters) and of Civil Defense. The thresholds inherit the uncertainties of the calibration (event rainfall not measured in the watershed, inventory without separation between failure and deposit, a priori parameters from few tests, effective initial WT); uniform rainfall over the watershed ignores the variability of a convective cell; and the numerical forecast has a resolution of tens of kilometers. In Teresópolis, the thresholds were computed at 30 m, where the connected patch is much larger than at 10 m (Section 7.9.7): the volume criterion (red class) is reached at 30 m with rainfalls that, in the 10 m design runs, do not bring Vdy12* anywhere near Vdy2.
7.11 Synthesis, limitations and recommendations
Table 7.48 gathers the numbers of the TRIGRS × GIDES coupling in Teresópolis.
| Quantity | Value | Note |
|---|---|---|
| Watershed area (km²) | 3.108 | 31,084 cells of 10 m |
| Calibration — triggered MSR / MSR / AUC of the best sample | 0.56 / 0.56 / 0.76 | selected by triggered MSR; a priori: 0.53 / 0.53 / 0.79; 150 LHS samples in the 30 m window |
| Calibration — feasible samples (D21 filters) and relaxed constraints | 23 of 150 | relaxed: none |
| Calibration — triggered TSS / AUC (skill) | 0.11 / 0.76 | no skill: no (triggered TSS < 0.05 or AUC < 0.60) |
| Cross-validation — transferred MSR | 0.55 — Nova Friburgo (calibration window) | a priori at the target: 0.50 |
| Event — unstable fraction of the watershed (%) | 1.4 | 4.45 ha unstable |
| Event — Vdy12* (m³) | 26,931 | D19 total (upper bound): 26,931; all: 51,583; in situ (all): 59,550 |
| Initial condition — FS0 < 1 in the watershed: design / event (%) | 0.00 / 0.00 | patch Vdep at t = 0 (design): 0 m³; FS0 < 1 with the event land cover: 0.00% |
| Vdy12 — traditional (method b) × Vdy12* (100-yr, present; m³) | 82,067 × 25,546 | D19 total (upper bound): 25,546; initial share: 0.0% |
| Vdy1 — traditional × Vdy1* (100-yr, present; m³) | 217,633 × 161,112 | |
| Vdy2 — 100-yr: present / SSP2-4.5 / SSP5-8.5 2071–2100 P50 (m³) | 69,646 / 83,255 / 86,917 | |
| Vd — traditional × Vd* (100-yr, present; m³) | 69,646 (Vdy2) × 69,646 (Vdy2) | Vd* with the upper bound: 69,646; woody debris: Vwy = 344 m³ |
| Vd* — 100-yr: SSP2-4.5 / SSP5-8.5 2071–2100 P50 (m³) | 83,255 (Vdy2) / 86,917 (Vdy2) | |
| Vdy12* — change SSP5-8.5 2071–2100 P50 vs. present, 100-yr (%) | 0.0 | D19 total: 0.0% |
| 24-h threshold, base water table — 1% / 5% of the watershed / Vdy12* ≥ Vdy2 (mm) | 50 / 134 / 87 | watershed at 30 m; triggered fraction of the watershed (FS0 ≥ 1 at t = 0 and FS < 1, D21) |
| Most influential factor on the event Vdep | flowdir = hydro (+291.9 %) | |
| Resolution — patch Vdep at 10 m × 30 m (%) | −88.0 | |
| State of the results | final — full |
7.11.1 What changes for the Sabo dam
- Design volume. At TR 100 in the present, Vd* is 69,646 m³ — the same as the traditional method (69,646 m³) and the same with the upper bound of Vdy12* (69,646 m³) — close to the 73,000 m³ of the official design (JICA, 2026; Table 7.28). Since Vdy1* exceeds Vdy2 in every run (Vdy11 alone already suffices in all but one, Section 7.10.5), the volume is the one the rainfall can transport, and the choice of TR and climate scenario weighs more than the refinement of Vdy12. The refinement changes Vdy1, not Vd: Vdy1* (161,112 m³) is well below the traditional Vdy1 (217,633 m³) and closer to the Vdy1 of the official design (141,000 m³) — there is less material available on the hillslopes than method b assumes, but still more than the design rainfall can transport.
- Climate. Under SSP5-8.5 at the end of the century, the TR 100 Vd* changes by +24.8% at P50 and +49.0% at P90, in proportion to Vdy2, while Vdy12* does not change (it has been at the plateau since TR 100, Section 7.10.4): a barrier designed for the present climate needs a margin for this increase, or a design TR chosen by the equivalent future TR (Figure 7.22).
- Where the material comes from. The cells triggered by the design rainfall cover only 1.4% of the watershed at TR 100, and only part of them form patches connected to the drainage, on the steep hillslopes of the incised valleys (maps in Figure 7.34 and in Figure 7.36). Since the plateau does not change with climate, the TR 100 map also holds for the future scenarios. This is information for the auxiliary reference points on the northern and western branches (TR-C and TR-D, Section 7.2), for slope works and for monitoring.
- When. TRIGRS gives the time of instability and the watershed rainfall thresholds (Section 7.10.6), useful for local warning and for barrier maintenance (clearing after events), always as information complementary to the official warnings — with the caveat that the Teresópolis thresholds, computed at 30 m, are conservative.
7.11.2 Uncertainties and limitations
- Status of the results — final, full: all sources come from the D20 run, with the D21 selection; if the pipeline is run again and any source stops being final, a notice appears at the start of sections 8, 10 and 11.
- Event rainfall — it was not measured in the watershed; the sources differ by a factor of nearly three (Table 7.1) and MERGE underestimates the event (D14). The minimum and maximum scenarios enter the sensitivity analysis, but the calibration uses the central one.
- Inventory — manual mapping of 2011, shifted (D17), without separating failure, track and deposit; source area approximated by the upper third; many polygons smaller than the 30 m cell; DEM postdating the event.
- Parameters — a priori values from few tests (Esteves et al., 2024, in the watershed itself); granite and orthogneiss with the same values; root cohesion measured only once in the region (José, 2016).
- Thickness and WT —
zmaxderived from slope alone, the worst option in Segoni et al. (2012); initial WT as a uniform fraction ofzmax, an effective and unmeasured parameter, kept the same in the present and in the future: the design volumes hold for this initial condition. - Selection — the limits of the D21 filters (1%, 5%, 30% and a triggered TPR of 0.05) come from the literature but have no universal value, and the distances between the best samples are small (top 3: lhs_0019 (0.556); lhs_0105 (0.552); lhs_0108 (0.550)). Skill flag: minimum skill met (triggered TSS 0.11 ≥ 0.05 and AUC 0.76 ≥ 0.60).
- Model — one-dimensional infinite slope, without lateral subsurface flow and without propagation of the mass; connectivity is an indicator of the material that reaches the channel, not a simulation of the debris flow. As a spatial ranker of susceptibility, the calibrated FS does not outperform slope alone (AUC of 0.76 against 0.85; Section 7.9.4).
- Timing — the 24-h rain-free window was sized with the central Ks of the colluvium (Section 7.8.4). The calibrated Ks is 0.70 times the central value (Table 7.35), which lengthens the travel time of the front only in inverse proportion; at the same time, the calibrated thickness is smaller (mz = 0.62) and the initial WT lies at fNA = 0.50 of the thickness, which shortens the path of the front to the WT. In the 2011 event, the watershed instability follows the rainfall peak, with no visible delay, in the FS frames every 2 h (
produtos/animacao/quadros.json): there is no sign of a response truncated by the window, although a longer window was not tested. - Resolution — the 10 m DEM is the ~30 m one resampled; connectivity and volume change with resolution (in the event, the patch Vdep changes by −88.0% from 30 to 10 m; see the sensitivity analysis, Section 7.9.7), and the Teresópolis thresholds were computed at 30 m.
- Traditional method — Vdy11 and Vwy depend on cross-section assumptions (Bd, De) without a field survey, and the channel threshold changes Vdy11 and, with it, the transport × supply regime (Table 7.24).
7.11.3 Recommendations
- Municipal inventory — obtain or produce, with the municipality and DRM-RJ (the Rio de Janeiro State Geological Survey), a scar inventory with failure, track and deposit separated, and recalibrate without the upper-third approximation.
- Tests — saturated direct shear, field hydraulic conductivity (Guelph permeameter) and retention curves in the colluvium and residual soils of the watershed, extending those of Esteves et al. (2024), and root-cohesion measurements under forest.
- Measured WT and moisture — piezometers and tensiometers on representative hillslopes, including upslope of the houses along the Estrada José da Rocha road, to replace the calibrated fraction fNA and test the unsaturated model; meanwhile, test fNA = 0.9 (wet-season perched water table) and a
rizeroset by the antecedent rainfall of each event (report 13). - LiDAR and field survey — a high-resolution DEM (preferably with a pre-event surface, for the thickness of the scars), hand-auger and SPT soundings for
zmax, Bd·De sections of the bed for Vdy11 and a forest inventory for Vwy. - Rainfall — a rain gauge in the watershed (the 2011 event was not measured) and the use of radar and real-time satellite rainfall in the Forecast tab.
- Recalibration — redo the calibration with the data above, keeping the D21 filters (hillslopes stable before the rain), the sensitivity to their limits and the cross-validation before any operational use of the thresholds; widen the ranges of the multipliers that ended up close to the limits of the hypercube (thickness, α,
rizeroand root cohesion) and also compute the thresholds at 10 m.
7.12 Reproducibility
The results of these sections come from three layers of code in the companion repository (the project’s Python 3.12; TRIGRS 2.1.0 compiled in engine/bin): the trigrs_mapper pipeline (steps grades, calibrar, params, evento, projeto, sensibilidade, limiares, produtos and figuras), the generator of the chapter results and the generator of the text.
Teresópolis — full run (D20, D21) and individual steps (at the root of the trigrs-mapper project)
# full run, at low priority (nice 10): grades → calibrar (+ cross-validation) → [release]
#   → params → evento → projeto → produtos → figuras → sensibilidade → limiares → produtos → figuras
nohup scripts/pipeline/rodar_completo.sh teresopolis 5 > /dev/null 2>&1 &
# D21, after the calibration batch: checks the 151 signatures, redoes the selection (calibrar --forcar,
# with no new runs besides the cross-validation), applies nmax 300 and only then releases the next steps
nohup .venv/bin/python scripts/pipeline/aplicar_d21_e_liberar.py teresopolis --cpus 5 &
# or by hand
.venv/bin/trigrs-mapper caso teresopolis calibrar --forcar --max-cpus 2
touch _operacional/rodada_completa/liberar_teresopolis   # releases the post-calibration steps
echo 4 > _operacional/rodada_completa/cpus_teresopolis    # CPUs of the next steps
# one step at a time (options: --res 10|30, --max-cpus N, --mpi, --reduzido, --forcar, --n-lhs N)
.venv/bin/trigrs-mapper caso teresopolis calibrar --max-cpus 8
.venv/bin/trigrs-mapper caso teresopolis evento --max-cpus 8 --mpi
.venv/bin/trigrs-mapper estado teresopolis
# smoke test (6 LHS samples; 2 TR × 2 scenarios)
scripts/pipeline/rodar_caso.sh teresopolis --reduzido --max-cpus 8
# variables, tables and figures of sections 8 to 12 (PT and EN) and check
.venv/bin/python scripts/capitulos/gerar_resultados_trigrs.py --casos teresopolis
.venv/bin/python scripts/capitulos/gerar_resultados_trigrs.py --verificar
# Portuguese text of the chapter (template scripts/casos/teresopolis/modelos/07-teresopolis.qmd.j2)
.venv/bin/python scripts/casos/teresopolis/08_textos.py
The results generator does no calculations beyond sums, ratios and changes: it reads the products in data/cases/teresopolis/, writes the ter.* variables of _variables.yml (and en/_variables.yml) and the files of _gerado/teresopolis/ (tables and the annotated tr_in.txt), and copies the figures. Running it again updates all the numbers of these sections without touching the text; if any source stops coming from the full run or becomes inconsistent with the case YAML (the selection objective and the main Vdy12* form of D21), a notice appears at the start of sections 8, 10 and 11. The ter.diag.* diagnostics (AUC of slope, Zcr = zmax and unstable fraction at 30 and at 10 m) come from scripts/capitulos/diagnosticos_independentes.py, which writes calibracao/diagnosticos.json.
Reproducing the case (at the root of the trigrs-mapper project)
# everything, in order (the event runs before and after the calibration)
scripts/pipeline/rodar_caso.sh teresopolis --max-cpus 8 --mpi
# or stage by stage
.venv/bin/trigrs-mapper caso teresopolis grades
.venv/bin/trigrs-mapper caso teresopolis calibrar --max-cpus 8      # LHS + cross-validation
.venv/bin/trigrs-mapper caso teresopolis params
.venv/bin/trigrs-mapper caso teresopolis evento --max-cpus 8 --mpi
.venv/bin/trigrs-mapper caso teresopolis projeto --max-cpus 8
.venv/bin/trigrs-mapper caso teresopolis sensibilidade --max-cpus 8 --mpi
.venv/bin/trigrs-mapper caso teresopolis limiares --max-cpus 8
.venv/bin/trigrs-mapper caso teresopolis produtos
.venv/bin/trigrs-mapper caso teresopolis figuras
# numbers, tables and figures of these sections (PT and EN)
.venv/bin/python scripts/capitulos/gerar_resultados_trigrs.py --destino <short-course repository>trigrs-mapper caso <case> <stage>; manifests data/cases/<case>/logs/etapa_*.json): mode, CPUs, wall-clock duration and, for stages with serial runs, the sum of the TRIGRS run durations (CPU·h). Shared 12-core VPS; times vary with the load.
| Stage | Command | Mode; status | CPUs | Duration (h) | CPU·h (runs) | End (Brasília) |
|---|---|---|---|---|---|---|
| grids | grades |
full; completed | 5 | < 0.01 | n/a | 2026-10-31 18:41 |
| calibration + cross-validation | calibrar |
full; completed | 2 | 0.08 | 23.4 | 2026-10-31 23:33 |
| parameterization (documentation) | params |
full; completed | 6 | < 0.01 | n/a | 2026-10-31 23:33 |
| event (30 m window + 10 m watershed) | evento --mpi |
full; completed | 6 | 0.37 | n/a | 2026-10-31 23:56 |
| design runs (return period × scenarios) | projeto |
full; completed | 6 | 1.84 | 10.7 | 2026-11-01 01:46 |
| sensitivity | sensibilidade --mpi |
full; completed | 9 | 0.65 | 2.8 | 2026-11-01 02:25 |
| thresholds | limiares |
full; completed | 9 | 0.27 | n/a | 2026-11-01 02:42 |
| products | produtos |
full; completed | 1 | < 0.01 | n/a | 2026-11-01 03:51 |
| figures | figuras |
full; completed | 9 | < 0.01 | n/a | 2026-11-01 02:42 |
| Component | Version / identification |
|---|---|
| TRIGRS (serial) | 2.1.00a (26 Aug 2016); SHA-256 afb53a06daa4… |
| TopoIndex | SHA-256 832f46b4023a… |
| TRIGRS-P (MPI) | SHA-256 5b20f00464c9… |
| Python | 3.12.15 |
| gdal | 3.12.2 |
| geopandas | 1.2.0 |
| matplotlib | 3.11.2 |
| numpy | 2.5.4 |
| pandas | 3.1.0 |
| pyproj | 3.8.0 |
| rasterio | 1.5.2 |
| scipy | 1.18.1 |
| shapely | 2.2.0 |
| trigrs-mapper | 0.1.0 |
| Platform | Linux-5.15.0-198-generic-x86_64-with-glibc2.35 |
The runs used Python 3.12.15, TRIGRS 2.1.00a (26 Aug 2016; SHA-256 of the executable starting with afb53a06daa4), numpy 2.5.4, scipy 1.18.1, rasterio 1.5.2 and GDAL 3.12.2 (Table 7.50); the last step completed is from 2026-11-01. The 151 calibration runs (full mode) took 23.4 CPU·h; the last execution of the step, the D21 calibrar --forcar with 2 CPUs, reused these runs and redid only the selection and the cross-validation, in 0.08 h of wall time. The sensitivity analysis took 2.8 CPU·h and the design runs 10.7 CPU·h; the last executions of the steps add up to 3.21 h of wall time (Table 7.49). The times vary with the load of the VPS (12 shared cores) and by up to four times with the multipliers, which change the number of terms of the series.
Each step writes a manifest (logs/etapa_<etapa>.json) with the signature of the arguments, of the case YAML, of the parameter table, of the calibration in use and of the rainfall and GIDES files; a completed step with the same signature is skipped, and each TRIGRS run is reused only if tr_in.txt and the grids are identical — this is what allows the D21 selection to be redone without running the 151 calibration runs again. Code changes do not enter the signature: after updating the package, use --forcar. The data are kept out of Git and can be recreated with the commands above (Table 7.51); the read-only inputs are data/cases/teresopolis/{bacia,chuva,gides}, data/interim/{bases,parametros,clima}, the inventories, the images, MERGE and ANADEM.
Folder (in data/cases/teresopolis/) |
Contents |
|---|---|
grids/ |
TRIGRS grids of the window (30 m) and of the watershed (10 m and 30 m) with grade.json (SHA-256); params_<cobertura>/ with zones, zmax, depthwt and rizero |
runs/ |
one folder per run: tr_in.txt, tpx_in.txt, rodada.json, resultado.json, resultado.npz (compressed FS and Zcr) and logs |
calibracao/ |
calibracao.json (with the record of the selection and the D21 skill flag), lhs.csv, melhor.json, conjunto/, validacao_cruzada.json, evento/, sensibilidade.json and projeto.json (in the smoke test, with the suffix _reduzido/_reduzida) |
produtos/ |
resumo.json, COG layers (EPSG:31983), GeoJSON vectors (EPSG:4326), series (curva_volume_tr.json, limiares.json etc.), FS animation and PT/EN figures |
logs/ |
step manifests (signature, duration, versions and SHA-256 of the executables) and dated logs |
The original (Portuguese) text of these sections is in the same template as sections 1 to 7 (scripts/casos/teresopolis/modelos/07-teresopolis.qmd.j2, rendered by 08_textos.py); the numbers enter through the ter.* variables and the files of _gerado/teresopolis/, written by scripts/capitulos/gerar_resultados_trigrs.py from data/cases/teresopolis/. The pipeline method, costs and limitations are in docs/METODO-PIPELINE.md; the decisions cited (D5–D21), in docs/decisoes/DECISOES.md; and the diagnosis of the instability before the event, in docs/pesquisa/13_instabilidade_pre_evento.md.
References cited in this chapter
- AKAIKE, H. A new look at the statistical model identification. IEEE Transactions on Automatic Control, 19(6), 716–723, 1974. DOI: 10.1109/TAC.1974.1100705.
- ALVIOLI, M.; BAUM, R. L. Parallelization of the TRIGRS model for rainfall-induced landslides using the message passing interface. Environmental Modelling & Software, 81, 122–135, 2016. DOI: 10.1016/j.envsoft.2016.04.002.
- BARNES, R.; LEHMAN, C.; MULLA, D. An efficient assignment of drainage direction over flat surfaces in raster digital elevation models. Computers & Geosciences, 62, 128–135, 2014. DOI: 10.1016/j.cageo.2013.01.009.
- BAUM, R. L.; GODT, J. W.; SAVAGE, W. Z. Estimating the timing and location of shallow rainfall-induced landslides using a model for transient, unsaturated infiltration. Journal of Geophysical Research: Earth Surface, 115, F03013, 2010. DOI: 10.1029/2009JF001321.
- BAUM, R. L.; SAVAGE, W. Z.; GODT, J. W. TRIGRS — A Fortran program for transient rainfall infiltration and grid-based regional slope-stability analysis, version 2.0. U.S. Geological Survey Open-File Report 2008-1159, 2008. DOI: 10.3133/ofr20081159.
- BRASIL. Ministério da Integração Nacional [Ministry of National Integration]/SEDEC; JICA. Projeto GIDES – Manual técnico para concepção de intervenções para fluxo de detritos [GIDES Project – Technical manual for the design of debris-flow interventions]. Brasília: MI/SEDEC, 2018 (rev. 2019). Appendix A – Nova Friburgo/RJ. In Portuguese.
- CABRAL, V.; REIS, F.; VELOSO, V.; CORREA, C.; KUHN, C.; ZARFL, C. The consequences of debris flows in Brazil: a historical analysis based on recorded events in the last 100 years. Landslides, 20(3), 511–529, 2023. DOI: 10.1007/s10346-022-01984-7.
- CHOW, V. T. Hydrologic determination of waterway areas for the design of drainage structures in small drainage basins. Urbana: University of Illinois, Engineering Experiment Station Bulletin 462, 1962.
- CHOW, V. T.; MAIDMENT, D. R.; MAYS, L. W. Applied Hydrology. New York: McGraw-Hill, 1988.
- CLIMANÁLISE. Boletim de Monitoramento e Análise Climática [Climate Monitoring and Analysis Bulletin], vol. 26, no. 1, Jan. 2011. Cachoeira Paulista: INPE/CPTEC. In Portuguese.
- COHEN, J. A coefficient of agreement for nominal scales. Educational and Psychological Measurement, 20(1), 37–46, 1960.
- CONQ, M.; SILVEIRA, C. S.; DOURADO, F. Processos geomorfológicos e danos derivados da corrida de detritos de janeiro 2011 na bacia do Córrego do Príncipe, Teresópolis – Região Serrana do Rio de Janeiro [Geomorphological processes and damage resulting from the January 2011 debris flow in the Córrego do Príncipe basin, Teresópolis – Rio de Janeiro Highlands]. Ciência e Natura, 37(1), 93–103, 2015. DOI: 10.5902/2179460X14872. In Portuguese.
- DAEE/CETESB. Drenagem urbana: manual de projeto [Urban drainage: design manual]. São Paulo: DAEE/CETESB, 1980. In Portuguese.
- DEROSE, R. C. Relationships between slope morphology, regolith depth, and the incidence of shallow landslides in eastern Taranaki hill country. Zeitschrift für Geomorphologie, Supplementband 105, 49–60, 1996.
- EMBERSON, R.; KIRSCHBAUM, D. B.; AMATYA, P.; TANYAS, H.; MARC, O. Insights from the topographic characteristics of a large global catalog of rainfall-induced landslide event inventories. Natural Hazards and Earth System Sciences, 22, 1129–1149, 2022. DOI: 10.5194/nhess-22-1129-2022.
- ESTEVES, J. V. P.; BECKER, L. B.; GOBBI, F. Parâmetros geotécnicos e de mapas de suscetibilidade da Bacia do Córrego do Rio do Príncipe (Teresópolis/RJ), utilizando o software SHALSTAB [Geotechnical parameters and susceptibility maps of the Córrego do Rio do Príncipe basin (Teresópolis, RJ) using the SHALSTAB software]. In: XXI COBRAMSEG [21st Brazilian Congress of Soil Mechanics and Geotechnical Engineering]. Balneário Camboriú, SC, 2024. In Portuguese.
- FAWCETT, T. An introduction to ROC analysis. Pattern Recognition Letters, 27(8), 861–874, 2006. DOI: 10.1016/j.patrec.2005.10.010.
- GARDNER, W. R. Some steady-state solutions of the unsaturated moisture flow equation with application to evaporation from a water table. Soil Science, 85(4), 228–232, 1958.
- GIANDOTTI, M. Previsione delle piene e delle magre dei corsi d’acqua. Memorie e Studi Idrografici, v. 8. Roma: Servizio Idrografico Italiano, 1934. In Italian.
- HERSHFIELD, D. M. Rainfall frequency atlas of the United States for durations from 30 minutes to 24 hours and return periods from 1 to 100 years. Technical Paper No. 40. Washington, DC: U.S. Weather Bureau, 1961.
- HOSKING, J. R. M.; WALLIS, J. R. Regional Frequency Analysis: an approach based on L-moments. Cambridge: Cambridge University Press, 1997. DOI: 10.1017/CBO9780511529443.
- HUANG, J. C.; KAO, S. J. Optimal estimator for assessing landslide model performance. Hydrology and Earth System Sciences, 10, 957–965, 2006. DOI: 10.5194/hess-10-957-2006.
- IVERSON, R. M. Landslide triggering by rain infiltration. Water Resources Research, 36(7), 1897–1910, 2000. DOI: 10.1029/2000WR900090.
- JICA; YACHIYO ENGINEERING; SABO & LANDSLIDE TECHNICAL CENTER; CTI ENGINEERING INTERNATIONAL. Projeto SABO — Apresentação de Exemplos [SABO Project — Presentation of Examples]: Part 1 (selection of the thalwegs) and Part 3 (Teresópolis/RJ pilot project). Brasília: MIDR/SEDEC; JICA, June 2026. In Portuguese.
- JOSÉ, F. O. Análise do incremento de resistência ao cisalhamento do solo conferido por raízes florestais em Nova Friburgo, RJ [Analysis of the increase in soil shear strength provided by forest roots in Nova Friburgo, RJ]. M.Sc. dissertation (Civil Engineering) – COPPE/UFRJ, Rio de Janeiro, 2016. In Portuguese.
- KIRPICH, Z. P. Time of concentration of small agricultural watersheds. Civil Engineering, 10(6), 362, 1940.
- LAIPELT, L.; ANDRADE, B. C.; COLLISCHONN, W.; TEIXEIRA, A. A.; PAIVA, R. C. D.; RUHOFF, A. ANADEM: A Digital Terrain Model for South America. Remote Sensing, 16(13), 2321, 2024. DOI: 10.3390/rs16132321.
- MARC, O.; STUMPF, A.; MALET, J.-P.; GOSSET, M.; UCHIDA, T.; CHIANG, S.-H. Initial insights from a global database of rainfall-induced landslide inventories: the weak influence of slope and strong influence of total storm rainfall. Earth Surface Dynamics, 6, 903–922, 2018. DOI: 10.5194/esurf-6-903-2018.
- MARQUES, M. C. O.; SILVA, R.; FRAGA, J.; COELHO NETTO, A. L.; SATO, A. M. The influence of vegetation cover and soil physical properties on deflagration of shallow landslides – Nova Friburgo, RJ/Brazil. Geophysical Research Abstracts, 19, EGU2017-17776-3, 2017.
- MCKAY, M. D.; BECKMAN, R. J.; CONOVER, W. J. A comparison of three methods for selecting values of input variables in the analysis of output from a computer code. Technometrics, 21(2), 239–245, 1979.
- NILIM. Manual of technical standard for establishing Sabo master plan for debris flow and driftwood. Technical Note of NILIM No. 904. Tsukuba: NILIM, 2016.
- O’CALLAGHAN, J. F.; MARK, D. M. The extraction of drainage networks from digital elevation data. Computer Vision, Graphics, and Image Processing, 28(3), 323–344, 1984. DOI: 10.1016/S0734-189X(84)80011-0.
- PARK, D. W.; NIKHIL, N. V.; LEE, S. R. Landslide and debris flow susceptibility zonation using TRIGRS for the 2011 Seoul landslide event. Natural Hazards and Earth System Sciences, 13, 2833–2849, 2013. DOI: 10.5194/nhess-13-2833-2013.
- PELIZONI, A. B. Análise de fluxo de detritos na Região Serrana Fluminense [Debris-flow analysis in the Rio de Janeiro Highlands]. M.Sc. dissertation (Civil Engineering) – COPPE/UFRJ, Rio de Janeiro, 2014. In Portuguese.
- POGGIO, L. et al. SoilGrids 2.0: producing soil information for the globe with quantified spatial uncertainty. SOIL, 7, 217–240, 2021. DOI: 10.5194/soil-7-217-2021.
- POTAPOV, P. et al. The global 2000–2020 land cover and land use change dataset derived from the Landsat archive: first results. Frontiers in Remote Sensing, 3, 856903, 2022. DOI: 10.3389/frsen.2022.856903.
- RAIA, S.; ALVIOLI, M.; ROSSI, M.; BAUM, R. L.; GODT, J. W.; GUZZETTI, F. Improving predictive power of physically based rainfall-induced shallow landslide models: a probabilistic approach. Geoscientific Model Development, 7, 495–514, 2014. DOI: 10.5194/gmd-7-495-2014.
- ROZANTE, J. R. et al. Combining TRMM and surface observations of precipitation: technique and validation over South America. Weather and Forecasting, 25, 885–894, 2010.
- SALCIARINI, D.; GODT, J. W.; SAVAGE, W. Z.; CONVERSINI, P.; BAUM, R. L.; MICHAEL, J. A. Modeling regional initiation of rainfall-induced shallow landslides in the eastern Umbria Region of central Italy. Landslides, 3(3), 181–194, 2006. DOI: 10.1007/s10346-006-0037-0.
- SANTOS, L. G. F. Ações da SEDEC/CBMERJ — Região Serrana 2011/2013 [SEDEC/CBMERJ actions — Rio de Janeiro Highlands 2011/2013]. Presentation at a public hearing, Brazilian Chamber of Deputies, Apr. 2013 (SEDEC-RJ/CBMERJ official toll). In Portuguese.
- SARTORI, A.; LOMBARDI NETO, F.; GENOVEZ, A. M. Classificação hidrológica de solos brasileiros para a estimativa da chuva excedente com o método do Serviço de Conservação do Solo dos Estados Unidos. Parte 1: classificação [Hydrologic classification of Brazilian soils for estimating excess rainfall with the U.S. Soil Conservation Service method. Part 1: classification]. Revista Brasileira de Recursos Hídricos, 10(4), 5–18, 2005. In Portuguese.
- SCHILIRÒ, L.; ESPOSITO, C.; SCARASCIA MUGNOZZA, G. Evaluation of shallow landslide-triggering scenarios through a physically based approach: an example of application in the southern Messina area (northeastern Sicily, Italy). Natural Hazards and Earth System Sciences, 15, 2091–2109, 2015. DOI: 10.5194/nhess-15-2091-2015.
- SEDEC/MIDR. Portal IDF-MC — curvas IDF sob mudança do clima [IDF-MC Portal — IDF curves under climate change] (methodology; data release 2026.08.002). https://idf-mc.dpm-sedec-sas.tech, 2026.
- SEGONI, S.; ROSSI, G.; CATANI, F. Improving basin scale shallow landslide modelling using reliable soil thickness maps. Natural Hazards, 61(1), 85–101, 2012. DOI: 10.1007/s11069-011-9770-3.
- SHANGGUAN, W.; HENGL, T.; MENDES DE JESUS, J.; YUAN, H.; DAI, Y. Mapping the global depth to bedrock for land surface modeling. Journal of Advances in Modeling Earth Systems, 9, 65–88, 2017. DOI: 10.1002/2016MS000686.
- SILVEIRA, A. L. L. Equação para os coeficientes de desagregação de chuva [An equation for the rainfall disaggregation coefficients]. Revista Brasileira de Recursos Hídricos, 5(4), 143–147, 2000. In Portuguese.
- SILVEIRA, A. L. L. Desempenho de fórmulas de tempo de concentração em bacias urbanas e rurais [Performance of time-of-concentration formulas in urban and rural watersheds]. Revista Brasileira de Recursos Hídricos, 10(1), 5–23, 2005. In Portuguese.
- SRIVASTAVA, R.; YEH, T.-C. J. Analytical solutions for one-dimensional, transient infiltration toward the water table in homogeneous and layered soils. Water Resources Research, 27, 753–762, 1991.
- STEPHENS, M. A. EDF statistics for goodness of fit and some comparisons. Journal of the American Statistical Association, 69(347), 730–737, 1974. DOI: 10.1080/01621459.1974.10480196.
- STRAHLER, A. N. Quantitative analysis of watershed geomorphology. Transactions, American Geophysical Union, 38(6), 913–920, 1957. DOI: 10.1029/TR038i006p00913.
- TAKAHASHI, T. Mechanical characteristics of debris flow. Journal of the Hydraulics Division, ASCE, 104(HY8), 1153–1169, 1978.
- THRASHER, B.; WANG, W.; MICHAELIS, A.; MELTON, F.; LEE, T.; NEMANI, R. NASA Global Daily Downscaled Projections, CMIP6. Scientific Data, 9, 262, 2022. DOI: 10.1038/s41597-022-01393-4.
- USDA-SCS. Urban hydrology for small watersheds. Technical Release 55 (TR-55), 2nd ed. Washington, DC: USDA Soil Conservation Service, 1986.
- WEISS, L. L. Ratio of true to fixed-interval maximum rainfall. Journal of the Hydraulics Division, ASCE, 90(HY1), 77–82, 1964.
- WORLD BANK (BANCO MUNDIAL). Avaliação de perdas e danos: inundações e deslizamentos na Região Serrana do Rio de Janeiro – janeiro de 2011 [Damage and loss assessment: floods and landslides in the Rio de Janeiro Highlands – January 2011]. Brasília: World Bank; Government of the State of Rio de Janeiro, 2012. In Portuguese.
- XAVIER, A. C.; SCANLON, B. R.; KING, C. W.; ALVES, A. I. New improved Brazilian daily weather gridded data (1961–2020). International Journal of Climatology, 42(16), 8390–8404, 2022. DOI: 10.1002/joc.7731.
- ZHANG, S.; JIANG, Q.; XU, X.; TAO, G.; ZHANG, Z.; GAO, X.; HE, C. Influence of soil mechanical and hydraulic parameters on the definition of rainfall intensity and duration thresholds based on TRIGRS. Frontiers in Earth Science, 10, 971655, 2022. DOI: 10.3389/feart.2022.971655.
- ZIEHER, T.; RUTZINGER, M.; SCHNEIDER-MUNTAU, B.; PERZL, F.; LEIDINGER, D.; FORMAYER, H.; GEITNER, C. Sensitivity analysis and calibration of a dynamic physically based slope stability model. Natural Hazards and Earth System Sciences, 17, 971–992, 2017. DOI: 10.5194/nhess-17-971-2017.